


















Article Contents
Article ID: CM2601102005
Views: 92Handwriting Feature Analysis Using MobileNetV2 in a Graphology-Based Personality Inference System
 PDF
PDF
⬇ Downloads: 10
1Department of Informatics Engineering, Universitas Trisakti, Jakarta, Indonesia
Received: 24 July, 2026
Accepted: 18 September, 2026
Revised: 11 September, 2026
Published: 24 September, 2026
ABSTRACT:
Introduction: Graphology has been defined through the term to signify the relationship between handwriting characteristics and individual personality. Conventional graphology analysis has been highly subjective and very time-consuming, and extremely dependent on expert judgment, creating a need for a more objective and efficient automated approach. This research builds an automated personality inference system from graphology using the MobileNetV2 model with transfer learning.
Methodology: Construction of models was done through three basic stages. First, automatic graphological feature extraction (auto-labeling) from 100 handwriting images using OpenCV-based Computer Vision, producing labels for five graphological features: letter size, slant, spacing, baseline, and pen pressure. Second, simultaneous classification of all the five features through the implementation of a multi-output MobileNetV2 architecture with a two-stage transfer learning approach, data augmentation, and class weighting to overcome class imbalance. Third, mapping the classification results to personality profiles using a rule-based inference system consisting of 13 IF-THEN rules derived from graphology literature. Since raw accuracy can be misleading when applied to such an imbalanced dataset of this size, the model was validated using Stratified 5-Fold Cross-Validation instead of single train-test split, with Macro F1-score and Balanced Accuracy reported alongside raw accuracy as the primary indicators of per-class performance. Averaged across the five folds, the model achieved a mean raw accuracy of 68.60%, but only 44.58% mean Balanced Accuracy and 39.03% mean Macro F1-score; a single 80:20 stratified split, evaluated separately, gave a comparable raw accuracy of 73%.
Results: It can be seen that the high raw accuracy conceals a substantial collapse in performance on minority categories, most visibly for the slant and baseline features, where the model largely defaults to predicting the single most common class; this class collapse, rather than the raw accuracy figure, is identified as the central limitation of the current system and is discussed in detail in the Results and Discussion sections. The present system is capable of producing 108 different personality profile combinations from the combination of the five graphological features and operates end-to-end, from handwritten image input to a transparent, scientifically traceable personality profile report.
Conclusion: The study therefore shows that graphology is not universally accepted as a scientifically validated method for personality assessment; accordingly, the personality descriptions generated by the system are presented as graphology-based interpretations rather than objective psychological evaluations.
Keywords: Computer vision, graphology, transfer learning, mobilenetV2, rule-based system, inference system.
1. INTRODUCTION
The invention of computer vision and deep learning techniques in the age of the Industrial Revolution 4.0 has created new possibilities of automation in different areas of image processing and pattern recognition, including biometric identification. One of the types of biometrics with great potential for analysis using this technology is handwriting, which not only functions as mean of communication medium but also contains unique characteristics for everyone [1]. The science that studies the relationship between handwriting characteristics and a person’s personality is known as graphology. In practice, graphology analysis observes various handwriting features such as letter size, slant, spacing between words, baseline, and pen pressure to identify, evaluate, and understand the writer’s personality [1]. Graphology cannot be generally accepted by scientists as a proven tool for personality testing, and the personality-related outputs discussed throughout this study are therefore interpretive, graphology-based descriptions rather than objective psychological or diagnostic conclusions. Handwriting is very significant aspect in Indonesia, for many processes, such as filling administrative forms, learning processes, and even signature to verify people’s identity. According to the information provided by the Central Statistics Agency (Badan Pusat Statistik) shows that approximately 77.02% of households have accessed the internet, while the remaining 22.98% have not, meaning digital transformation has not been fully evenly distributed and conventional methods, including handwriting is still common. For the recruitment industry, the modern company requires personality and psychometric test in candidate screening, and projective instruments based on handwriting strokes have become one of the standards used in large-scale selection processes. Also, Handwriting analysis is also applied field of forensic for document identification purposes. Nevertheless, these practices still rely on manual analysis methods that face operational bottlenecks in the form of subjective assessment and relatively long analysis time [2]. As an initial effort to address these limitations, the author previously developed an unpublished prototype system based on Convolutional Neural Networks (CNN) with a target output of nine Enneagram personality types. In this prototype there were two fundamental obstacles. First, the resulting model accuracy was still low due to the limited amount of available handwriting dataset, so the model did not have sufficient data to learn the variations in handwriting between individuals. Second, the use of Enneagram as the target label represented an inferential leap that was too far scientifically, since only a few indexed studies have validly and measurably proven a causal relationship between physical handwriting features and Enneagram personality types, making the resulting output difficult to scientifically justify.
A digital handwriting extraction approach for extracting the handwriting shape features and matching those with the Enneagram personalities using image pre-processing, Region of Interest (ROI) and fuzzy C- Means algorithm was proposed by Pratiwi et al. [3] to classify the dominating graphology features such as slant, size, baseline and spacing. The system achieved an accuracy of 81.6% between personality type predictions and Enneagram psychological indicators from 49 respondents [3]. Gagiu and Sendrescu implemented a tiered system that automatically extracts handwriting characteristics and links them with the Myers-Briggs Type Indicator (MBTI) using four CNNs, each trained for one graphological feature, achieving feature recognition accuracy of 89%–96% and MBTI prediction accuracy of 89%–91% [1].
CNN-based approaches have proven capable of hierarchically capturing complex visual patterns from images, and are therefore widely used in image processing research, including handwriting recognition and visual object classification [4]. Several CNN architectures such as VGGNet, ResNet, and Inception have been used in previous studies. VGGNet has a simple architecture but requires a large number of parameters, demanding high computational resources [5]. ResNet is able to overcome the vanishing gradient problem through residual connections, but has fairly high model complexity [6], while Inception can capture features at various scales with a relatively complex architecture [5]. Most of these studies still use manual feature extraction, which requires complex image processing and relies on explicit parameters, resulting in limited generalization to diverse handwriting variations.
An example of CNN architecture that stands out for handwriting recognition cases is MobileNetV2, which is designed with the concept of residual connections and depthwise separable convolution, enabling it to produce high performance with low computational complexity [4]. With the use of transfer learning approach, weights from a pre-trained model can be reused and specifically adapted to recognize the spatial extraction of handwriting, thereby accelerating convergence and achieving a good balance between classification accuracy and computational efficiency. Research on Chinese character handwriting recognition through four-channel convolution design using MobileNetV2 has been able to enhance the accuracy by extracting feature maps from various scales [7]. Further research has also indicated that features from visual handwriting can be input into the artificial intelligence models to classify certain patterns, including individual characteristics [8], which confirms the potential for integration between graphology with artificial intelligence.
In one of his research Gulzar proposed an automatic image classification model using MobileNetV2 using a two-phase hybrid transfer learning strategy that can classify 40 types of fruit from 26,149 images; this hybrid approach proved more effective than either training only the classifier head or performing fully fine-tuning from the start, especially on imbalanced datasets [9]. In another comparative analysis study evaluated the performance of various lightweight classification algorithms in detecting anomalies in handwriting strokes, showing that MobileNetV2 was able to significantly reduce parameter load compared to CNN architectures in general while still achieving superior spatial detection accuracy compared to SVM and Random Forest [10]. In another research they designed an automated Arabic handwriting recognition system that use grayscale, thresholding, and transfer learning from a pre-trained MobileNetV2, showing that depthwise separable convolution operations were highly robust in extracting spatial features from ink strokes, achieving 94% accuracy [11].
Champa and AnandaKumar developed an automatic system to predict human behavior through handwriting feature analysis using thresholding for pen pressure, polygonalization for baseline, template matching for the letter ‘t’ and slant, and the Generalized Hough Transform for the curvature of the letter ‘y’; the system, tested on 120 data samples, achieved an accuracy of 88% for letter ‘t’ analysis and 95% for pen pressure [12]. These studies show that the integration of conventional Computer Vision with lightweight CNN architectures such as MobileNetV2 is feasible for automated graphology analysis, and also serve as the basis for the choice of architecture and methods in this study.
From the above description, it becomes clear that this study deliberately limits the target output to the level of measurable graphological features, namely letter size, slant, spacing between words, writing baseline, and pen pressure, rather than mapping handwriting directly to a specific personality type as in the author’s earlier prototype. Such limitation is intended to increase the scientific credibility of work, as these five features can be validated using handwritten images and they have literature references. Prediction results of these five features are then integrated into a rule-based inference system that refers to validated graphology principles, so that the resulting personality profile is transparent and its scientific references can be traced at every decision step. It is also important to state from the outset that this study relies on a relatively small dataset of only 100 handwriting samples, a size that is generally considered insufficient for training deep learning models to their full potential; the implications of this limitation for model performance and generalizability are examined in detail in the Discussion section.
This study aims to: (1) build a graphological feature extraction system (size, slant, spacing, baseline, and pressure) using OpenCV-based Computer Vision techniques as a basis for automatic data labeling; (2) develop a classification model using the MobileNetV2 architecture with a transfer learning approach to accurately identify these five graphological features in handwriting images; and (3) design a rule-based personality inference system that maps the graphological feature classification results into descriptive personality profiles based on graphology principles.
2. METHODOLOGY
This study uses an applied research approach with an experimental method based on system development, aiming to test whether the MobileNetV2 architecture can classify graphological features with an adequate level of accuracy on an independently collected handwriting dataset. The overall research flow is presented in Fig. (1).
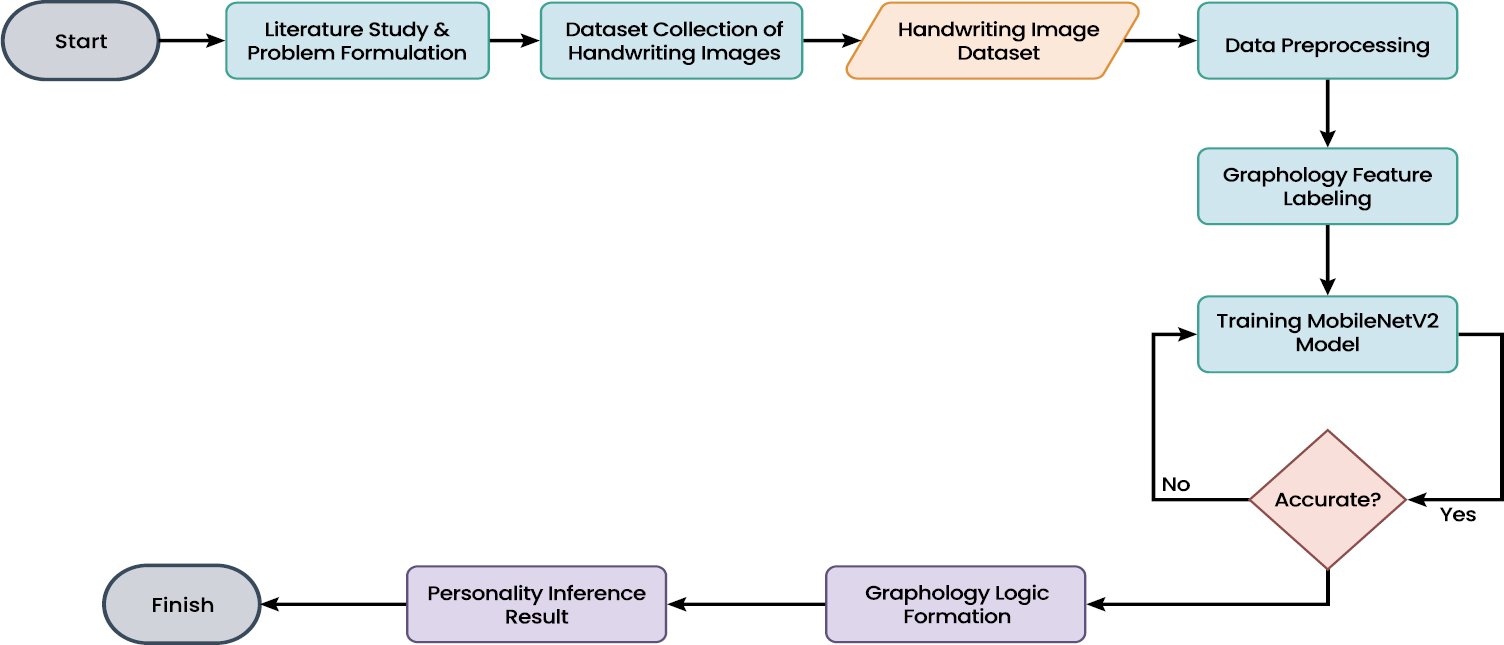
Fig. (1). Research flow.
2.1. Data Sources and Types
This study uses two types of data. Primary data comprises of handwriting images collected directly from 100 respondents, wherein each respondent wrote a paragraph of directed sentences on free-form paper (lined or unlined) with the use of pen, which was then documented as images using a smartphone camera under adequate lighting conditions. Secondary data comprises of graphology texts (scientific journals and reference books) used as the basis for constructing the personality inference system. The equipment and research environment used are summarized in Table 1.
Table 1. Research tools and system specifications.
| Category | Tools/Specifications |
| Programming Language | Python |
| Deep Learning Library | TensorFlow / Keras |
| Computer Vision Library | OpenCV |
| Data Analysis Library | NumPy, Pandas, Matplotlib, Scikit-Learn |
| Computing Environment | Google Colaboratory |
| Data Storage | Google Drive |
| Image Digitization | Smartphone Camera |
2.2. Image Preprocessing and Feature Extraction (Auto-Labeling)
Images in their raw form were processed by OpenCV before being fed into the model training pipeline, including grayscale conversion to remove color variations that are graphologically irrelevant, pixel normalization to a range of 0–1, resizing and padding to 224×224 pixels while maintaining aspect ratio to prevent geometric distortion, and histogram equalization to enhance the contrast of ink strokes against the paper background. The pre-processing process is illustrated in Fig. (2).
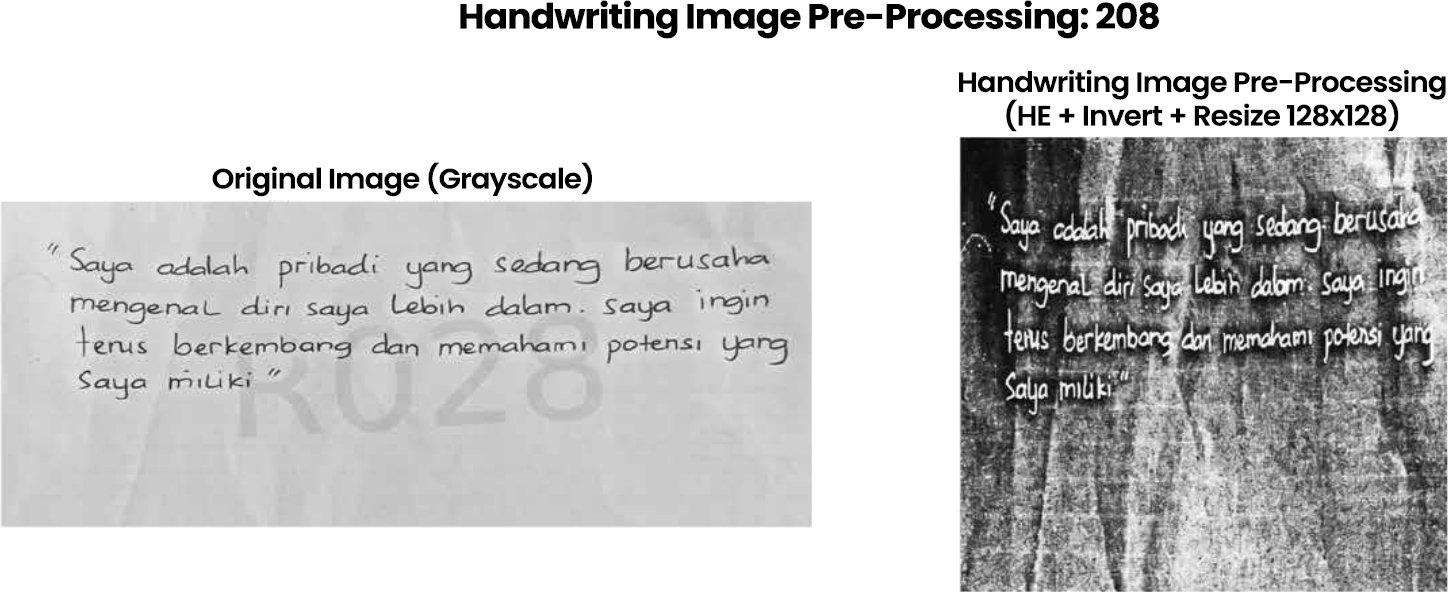
Fig. (2). Pre-processing.
The five graphological features were mathematically extracted using OpenCV algorithms to produce ground-truth labels. The letter size feature was determined from the average ratio of character bounding box height to image height [13], categorized as Small (ratio < 0.05), Medium, or Large (ratio > 0.15). The slant feature was calculated from the angle θ resulting from the Hough transform (HoughLines) on character components using Equation (1), categorized as Right Slant (θ > 10°), Upright, or Left Slant (θ < -10°) [13].
θ = arctan(Δy / Δx) (1)
where θ is the slant angle of the writing (in degrees), arctan is the inverse tangent function, and Δy and Δx are the vertical and horizontal coordinate differences, respectively. The baseline feature was determined from the slope of a linear regression line drawn through the base points of the writing per line using Equation (2), categorized as Ascending (negative slope), Straight, or Descending (positive slope) [14].
Slope = [n·Σ(xy) − Σx·Σy] / [n·Σ(x²) − (Σx)²] (2)
where n is the number of baseline points, and x and y are the horizontal and vertical coordinates of each baseline point. The pen pressure feature was measured from the average pixel intensity of the inverted stroke using Equation (3), categorized as Strong (value > 140) or Weak [15].
μstroke = (1/|S|) · Σ(255 − pi), for pi ∈ S (3)
where S is the set of ink stroke pixels, |S| is the number of pixels in the stroke area, pi is the intensity of the i-th pixel (grayscale), and 255 is the maximum intensity value. The word spacing feature was calculated from the average horizontal distance between words in a line using Equation (4), categorized as Wide (ratio > 0.8) or Tight [16].
d̄ = (1/n) · Σ di, i = 1..n (4)
where d̄ is the average distance between words, n is the number of word pairs calculated, and di is the horizontal distance between the i-th pair of words. Of the total 100 images collected, all 100 images were successfully processed through this auto-labeling stage and were ready to be used as model training data.
2.3. Model Architecture and Transfer Learning
2.3.1. Rationale for Selecting MobileNetV2
There were several reasons for choosing MobileNetV2 to be selected over deeper or wider CNN architectures. First, with only the training, validation, and test subsets described above (100 images in total), a lightweight architecture with much less trainable parameters than VGG16, ResNet, or InceptionV3 minimize the chances of overfitting on such a small dataset while still utilizing the benefits of ImageNet-pretrained features via transfer learning. Second, its depthwise separable convolutions make the inference computationally inexpensive, which matters for a system intended to run in accessible environments such as Google Colaboratory rather than requiring dedicated high-end hardware. Third, empirical comparisons in the transfer-learning literature support this choice for small-to-medium image classification tasks: Gulzar [9] found that a MobileNetV2-based transfer-learning model (TL-MobileNetV2) outperformed AlexNet, VGG16, InceptionV3, and ResNet on a 26,149-image fruit classification task by 8, 11, 6, and 10 percentage points, respectively, while requiring fewer parameters than all four. Table 2 below summarizes the approximate parameter counts and reported trade-offs of MobileNetV2 relative to the other architectures considered.
Table 2. Parameter counts and reported trade-offs of candidate CNN architectures.
| Architecture | Parameters | Reported Trade-off |
| MobileNetV2 | ~3.4M | Depthwise separable convolutions with inverted residuals give high accuracy per parameter and low computational cost, designed for mobile and resource-constrained deployment [21]. |
| VGG16 | ~138M | Simple, uniform architecture, but with a very high parameter count that demands substantial computational resources [5, 6]. |
| ResNet50/101 | ~25–44M | Residual connections overcome the vanishing-gradient problem but add architectural and computational complexity [6]. |
| InceptionV3 | ~24M | Captures multi-scale features via parallel convolutions, at the cost of a more complex, harder-to-tune architecture [5, 6]. |
| DenseNet121 | ~8M | Dense connections improve feature reuse but increase memory consumption during training compared to MobileNetV2. |
It should be stressed that the figures above are drawn from the cited literature on other image classification tasks, not from experiments run on the present study’s own handwriting dataset; a direct empirical comparison of MobileNetV2 against VGG16, ResNet, and other architectures using the same 100-image dataset and evaluation protocol described in this study was not performed and remains an important next step, as noted in the Discussion.
A related issue from methodology is why a convolutional network should even be required when OpenCV already does the five graphological measurements deterministic way; wouldn’t it be easier to just give these OpenCV-derived numeric measurements (the height ratio, slant angle, spacing ratio, baseline gradient, and stroke-intensity values underlying Equations (1)-(4)) directly into the rule-based inference engine, bypassing MobileNetV2 entirely? There are three factors that go against this simplification. Firstly, the OpenCV measurements are fixed-threshold heuristics (e.g., letter size is classified as Small below a height ratio of 0.05 and Large above 0.15) calibrated on this study’s own sample; such hard cutoffs are sensitive to nuisance variation in lighting, paper texture, ink bleed, and camera angle, whereas a CNN classifier trained end-to-end on the pixel image has the capacity to be more robust to this nuisance variation rather than reacting directly to a single scalar measurement corrupted by it. Secondly, MobileNetV2 receives the entire 224×224 image rather than five hand-engineered scalar summaries, giving it access to spatial and textural cues, such as local stroke curvature or pressure gradients within individual letters, that the OpenCV formulas do not capture at all; whether the network exploits this additional information effectively is an empirical question the present results only partially answer favorably, given the class collapse documented in the Results section, but the capacity to use it is a structural advantage that OpenCV features alone do not offer. Third, keeping MobileNetV2 as the classification stage leaves the system upgradeable independently of the OpenCV thresholds: if there is any larger or more diversified dataset available, the CNN can be retrained to learn new decision boundaries from data, whereas a rule engine driven purely by fixed OpenCV thresholds would require each cutoff to be manually re-derived. It should be noted, that the current study did not empirically benchmark a features-directly-to-rule-engine baseline (e.g., a simple classifier trained on the five OpenCV scalar measurements alone) against the MobileNetV2 pipeline; such a head-to-head comparison, reporting accuracy, Balanced Accuracy, and Macro F1-score for both approaches, is recommended as a concrete methodology to apply in future research rather than assumed in favor of the deep-learning approach.
The model was built based on the MobileNetV2 architecture to classify the five graphological features simultaneously in a single inference (multi-output), differing from conventional approaches that require a separate model for each feature. The input layer receives a 224 × 224-pixel image with 1 grayscale channel, which is then duplicated into 3 identical channels via a Concatenate layer to match the MobileNetV2 input specification. The MobileNetV2 backbone produces a 7×7×1280 feature map, which is flattened by Global Average Pooling into a 1,280-dimensional vector, then passed to two shared dense layers (256 and 128 neurons) that learn general graphological representations. Each graphological feature then has an independent classification head in the form of a 64-neuron dense layer with a softmax output. The model architecture is presented in Fig. (3).
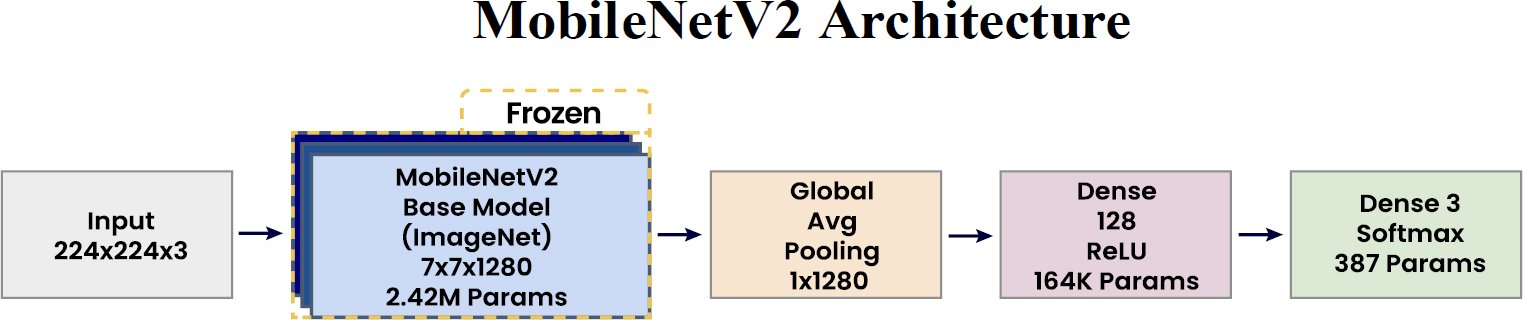
Fig. (3). MobileNetV2 architecture.
Training used a two-stage transfer learning approach with pre-trained ImageNet weights: in the first stage, the main convolutional layers of MobileNetV2 were frozen as a universal feature extractor, while only the added classifier head was retrained to recognize the graphological features [17]. The model has a total of 2,660,941 parameters, with 402,957 trainable parameters in the first stage and 2,257,984 non-trainable (frozen) parameters. The dataset of 100 images was split in two stages to obtain the training, validation, and test subsets. First, a stratified 80:20 split was applied to set aside 20 images as a held-out test set, following the recommendation that this ratio provides a good balance between training and test data on datasets of limited size [18]. This is further supported by the recommendation to use a training data portion of 80% or more on datasets with fewer than 1,000 samples in order to produce more consistent model performance estimates [19]. Second, from the remaining 80 images, 8 were further set aside as a validation subset used to monitor training and trigger early stopping, leaving 72 images for model training itself; stratification by class was maintained at both split stages so that each subset preserved, as closely as the small sample size allowed, the original class proportions of every feature. Data augmentation and class weighting were applied to handle class distribution imbalance in several features, and an EarlyStopping mechanism with a higher patience value was applied so that training would not stop prematurely due to fluctuations in validation accuracy on the limited validation data (8 images).
2.4. Stratified K-Fold Cross-Validation
To address the concern that a single 80:20 stratified split provides a statistically weak basis for estimating model performance on only 100 images, the evaluation described above was repeated using Stratified 5-Fold Cross-Validation. In each of the five folds, 20% of the images was held out as an independent test fold, stratified on the letter-size label used elsewhere in this study (scikit-learn’s StratifiedKFold accepts only one label per split, whereas the present model performs multi-output classification across five features); the remaining 80% of each fold was further split 90:10 into training and validation subsets following the same procedure as the single-split evaluation. A new MobileNetV2 multi-output model, re-initialized from ImageNet-pretrained weights, was trained independently for each fold, so that no image from a given fold’s test set was seen during that fold’s training or validation. Accuracy, Balanced Accuracy, and Macro F1-score were computed on the held-out test fold for each of the five graphological features, and the five per-fold values for each metric were summarized as mean ± standard deviation, reported in Table 3.
Table 3. Stratified 5-fold cross-validation results per graphological feature.
| Feature | Accuracy (mean ± SD) | Balanced Accuracy (mean ± SD) | Macro F1-score (mean ± SD) |
| Size | 56.00% ± 8.00% | 39.04% ± 8.90% | 34.55% ± 9.36% |
| Slant | 61.00% ± 8.60% | 36.90% ± 7.14% | 26.71% ± 4.36% |
| Spacing | 95.00% ± 3.16% | 60.00% ± 20.00% | 58.70% ± 20.65% |
| Baseline | 56.00% ± 10.20% | 37.56% ± 8.63% | 32.49% ± 8.18% |
| Pressure | 75.00% ± 8.94% | 49.41% ± 1.18% | 42.70% ± 3.03% |
| Average | 68.60% | 44.58% | 39.03% |
The cross-validated results in Table 3 confirm that the class collapse identified in the single-split evaluation (Tables 6 and 7) is a stable property of the current model and dataset rather than an artifact of one particular train-test partition: mean Balanced Accuracy (44.58%) and mean Macro F1-score (39.03%) across the five folds remain far below the mean raw accuracy (68.60%) for every feature except spacing. The slant and baseline features again show the weakest class-balanced performance (Balanced Accuracy of 36.90% and 37.56%, close to the 33% expected from random guessing among three classes), consistent with the single-split finding that the model tends to default to the majority class for these two features. The spacing feature shows the highest fold-to-fold variability of any feature (Macro F1-score of 58.70% ± 20.65%), which is expected given that only 5 of the 100 images carry the minority Wide label: with so few minority-class images, different folds by chance place different numbers of Wide samples in the test fold, so the resulting Macro F1-score swings sharply from fold to fold. Overall, the cross-validated estimates are directionally consistent with, but generally more conservative than, the single 80:20 split reported earlier in this study, which is expected because a single split can happen to place an easier-than-average subset of images into the test set; the K-fold results are therefore reported as the primary evidence for the model’s class-imbalance limitations discussed further in the Results and Discussion sections.
2.5. Rule-Based Personality Inference System
The physical feature extraction results from MobileNetV2 are then fed into a rule-based expert system that maps the feature matrix into a complete personality profile using conditional logic rules (IF-THEN) referring to graphology literature. The rule-based approach was chosen because the mapping rules between graphological features and personality already have an established theoretical basis, so they can be explicitly formulated without requiring an additional learning process. The inference system built consists of 13 rules covering the five graphological features, as summarized in Table 4.
Table 4. Rule-based personality inference.
| Feature | Category | Personality Description |
| Size | Large | High self-confidence, extroverted, enjoys being the center of attention |
| Medium | Adaptable, socially balanced, and flexible | |
| Small | High concentration, meticulous, analytical, tends to be introverted | |
| Slant | Right Slant | Expressive, future-oriented, easily shows emotions |
| Upright | Prioritizes logic, independent, good self-control | |
| Left Slant | Restrains emotions, self-protective, cautious | |
| Spacing | Wide | Values personal space, strong independence |
| Tight | Needs social closeness, enjoys interacting, warm | |
| Baseline | Ascending | Optimistic, ambitious, positive energy |
| Straight | Emotionally stable, disciplined, consistent in routine | |
| Descending | Tends toward mental fatigue, pessimism, or lack of motivation | |
| Pressure | Strong | Firm convictions, high vitality, strong commitment |
| Weak | Highly empathetic, flexible, dislikes being forced |
The inference mechanism works by matching the labels predicted by MobileNetV2 for the five features against the predefined rule base, thereby producing up to 108 different personality profile combinations in a single inference. It is not possible for any two rules in Table 4 to be triggered at the same time for the same feature, as the definition of each feature, mutually exclusive, and collectively exhaustive set of categories (e.g., size is always exactly one of Large, Medium, or Small), and the classification returns a unique label using the SoftMax-argmax prediction rather than a set of candidate labels; consequently, the rule engine always has exactly one applicable rule per feature and there is no run-time ambiguity to resolve at the inference stage. The categories themselves are also defined so that they do not overlap in the underlying continuous measurements: the OpenCV auto-labeling thresholds in the Image Preprocessing and Feature Extraction subsection partition each continuous measurement (e.g., the height ratio for size, the slant angle for slant) into disjoint intervals separated by a single strict cutoff, so that every measured value maps to exactly one category by construction; a value falling exactly on a threshold boundary is assigned by the corresponding comparison operator to one specific side of that boundary (for example, the pen pressure rule in the Methods section classifies a value of exactly 140 as Weak because the Strong category is defined by a strictly-greater-than comparison), and no image in the present dataset produced a value close enough to a threshold to make this boundary convention practically consequential. It should be noted that this absence of conflict is a property of the rule base’s category definitions rather than a guarantee that the underlying graphological categories are naturally well-separated; graphology literature and the class-imbalance results reported later in this study suggest that features such as slant and baseline vary more continuously in practice, this is one of the reasons why the classification accuracy of the model for these two features is comparatively lower even though the rule engine that uses their predicted labels never encounters ambiguity. Two kinds of measurements were taken for system evaluation and these are: technical measurement using a confusion matrix to calculate accuracy, balanced accuracy, precision, recall, and F1-score.
3. RESULTS
3.1. Auto-Labeling Results Distribution
The graphological feature extraction function successfully processed all 100 collected handwriting images into ground-truth labels for the five features. The resulting label distribution is presented in Table 5 and Fig. (4).
Table 5. Distribution of auto-labeled feature labels.
| Feature | Category | Number of Images | Percentage |
| Size | Medium | 53 | 53,0% |
| Small | 37 | 37,0% | |
| Large | 10 | 10,0% | |
| Slant | Right Slant | 62 | 62,0% |
| Upright | 26 | 26,0% | |
| Left Slant | 12 | 12,0% | |
| Spacing | Tight | 95 | 95,0% |
| Wide | 5 | 5,0% | |
| Baseline | Ascending | 59 | 59,0% |
| Straight | 25 | 25,0% | |
| Descending | 16 | 16,0% | |
| Pressure | Strong | 76 | 76,0% |
| Weak | 24 | 24,0% |
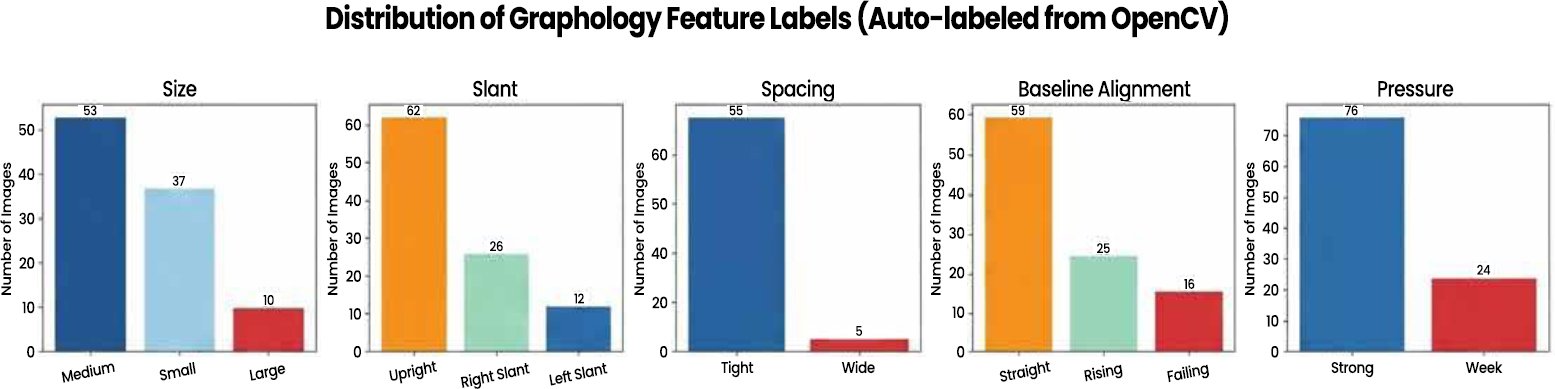
Fig. (4). Distribution of auto-labeled feature labels.
The label distribution for several features shows fairly noticeable imbalance. The spacing feature shows the most extreme imbalance, with 95.0% of the data labeled Tight and only 5.0% labeled Wide, indicating that most respondents wrote with tight spacing. A similar imbalance occurs in the pressure feature (76.0% labeled Strong), while the size and baseline features show relatively more varied distributions, although not yet fully balanced. This condition was an important consideration during the model training stage, so handling was carried out using class weighting to prevent the model from being biased toward the majority class.
3.1.1. Performance Evaluation of the Model for Each Feature
Evaluation was carried out on test data completely separate from the training data. The confusion matrices for the five graphological features are presented in Fig. (5), while the summary of accuracy and balanced accuracy per feature is presented in Table 6.
Table 6. Accuracy and balanced accuracy for each feature.
| Feature | Accuracy | Balanced Accuracy |
| Size | 65,00% | 56,49% |
| Slant | 55,00% | 33,33% |
| Spacing | 90,00% | 50,00% |
| Baseline | 75,00% | 40,28% |
| Pressure | 80,00% | 59,38% |
| Average Accuracy | 73,00% | 47,90% |
Table 7. Per-class precision, recall, and F1-score for each feature.
| Feature | Class | Precision | Recall | F1-Score |
| Size | Large | 100.00% | 50.00% | 66.67% |
| Medium | 62.50% | 90.91% | 74.07% | |
| Small | 66.67% | 28.57% | 40.00% | |
| Macro Avg | 76.39% | 56.49% | 60.25% | |
| Slant | Right Slant | 0.00% | 0.00% | 0.00% |
| Upright | 55.00% | 100.00% | 70.97% | |
| Left Slant | 0.00% | 0.00% | 0.00% | |
| Macro Avg | 18.33% | 33.33% | 23.66% | |
| Spacing | Tight | 90.00% | 100.00% | 94.74% |
| Wide | 0.00% | 0.00% | 0.00% | |
| Macro Avg | 45.00% | 50.00% | 47.37% | |
| Baseline | Straight | 87.50% | 87.50% | 87.50% |
| Ascending | 33.33% | 33.33% | 33.33% | |
| Descending | 0.00% | 0.00% | 0.00% | |
| Macro Avg | 40.28% | 40.28% | 40.28% | |
| Pressure | Strong | 83.33% | 93.75% | 88.24% |
| Weak | 50.00% | 25.00% | 33.33% | |
| Macro Avg | 66.67% | 59.38% | 60.78% |
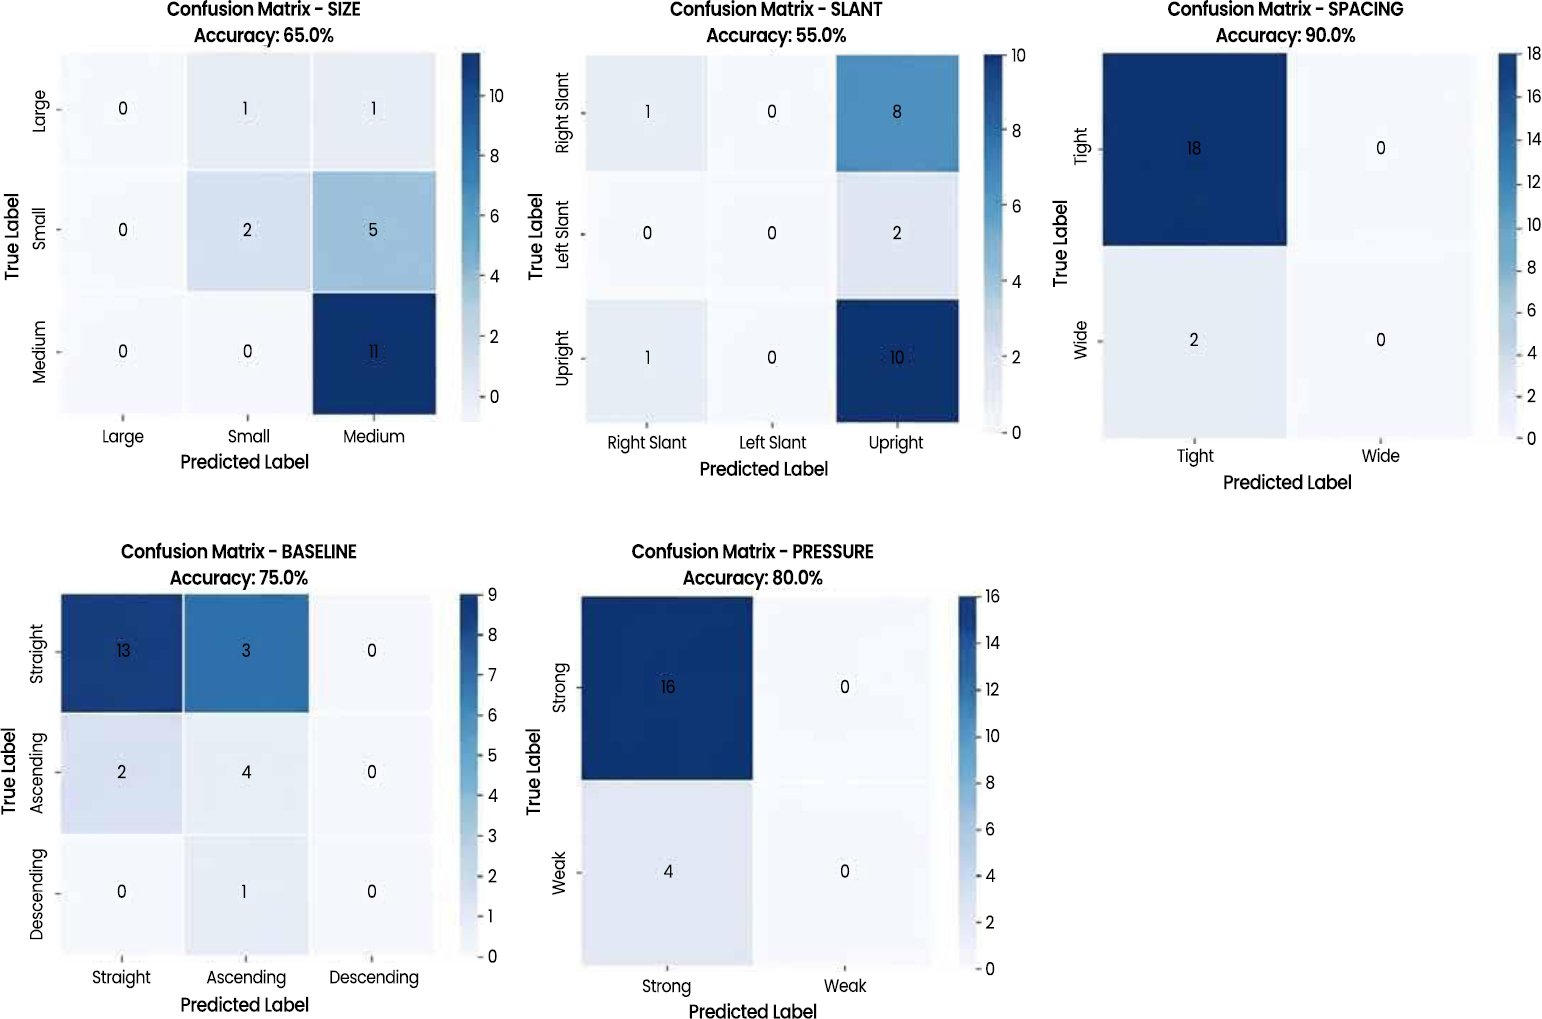
Fig. (5). Confusion matrices for the classification of individual graphological features.
The model was able to classify the spacing feature with the best performance (90.00%), followed by pressure (80.00%), baseline (75.00%), size (65.00%), and slant (55.00%), with an overall average accuracy of 73.00%. However, the much lower balanced accuracy values across all features indicate that this high accuracy is partly illusory due to class imbalance. For the spacing feature, for example, balanced accuracy was only 50.00% because, of the 20 test samples, 18 were labeled Tight; the model correctly predicted all Tight classes but failed completely on the Wide class, so the 90% accuracy was achieved simply by always predicting the majority class [20]. A similar pattern (class collapse on the minority class) is also seen in the slant and baseline features, where the MobileNetV2 model [21] tends to predict the majority class even though class weighting had been applied [22, 23].
The lowest accuracy in the slant feature (55.00%; balanced accuracy 33.33%, equivalent to random guessing among three classes) and size (65.00%; balanced accuracy 56.49%) is consistent with the characteristics of both features, which are continuous and have high intra-writer and inter-writer variation, so the boundaries between classes become less distinct and difficult for a convolution-based model to differentiate, especially when samples in the minority class are very limited [24, 25]. In contrast, the pressure accuracy (80.00%) is considered fairly representative because the distribution of writing pressure in the respondent population is naturally dominated by strong pressure [26], while variations in the position of letters, punctuation, and capital letters become a source of outliers that make accurately estimating the baseline gradient more difficult [27]. Overall, these results show that the transfer learning approach on MobileNetV2 is feasible for graphological feature classification, and further performance improvement is expected to be achievable through increasing the dataset size with better class balance, as also shown in studies on handling imbalanced data in general [28].
3.1.2. Personality Profile Inference
The final system test was conducted on a handwriting sample named file R028.jpg and produced an average confidence value of 71.2%. Based on the MobileNetV2 classification results, the image had small size, Upright slant, Tight spacing, Straight baseline, and Strong pen pressure, with the highest confidence on the spacing feature (91.1%) and the lowest on the size feature (56.6%). These five labels were then mapped through the rule-based rule base to produce a comprehensive personality profile, as shown in Fig. (6).
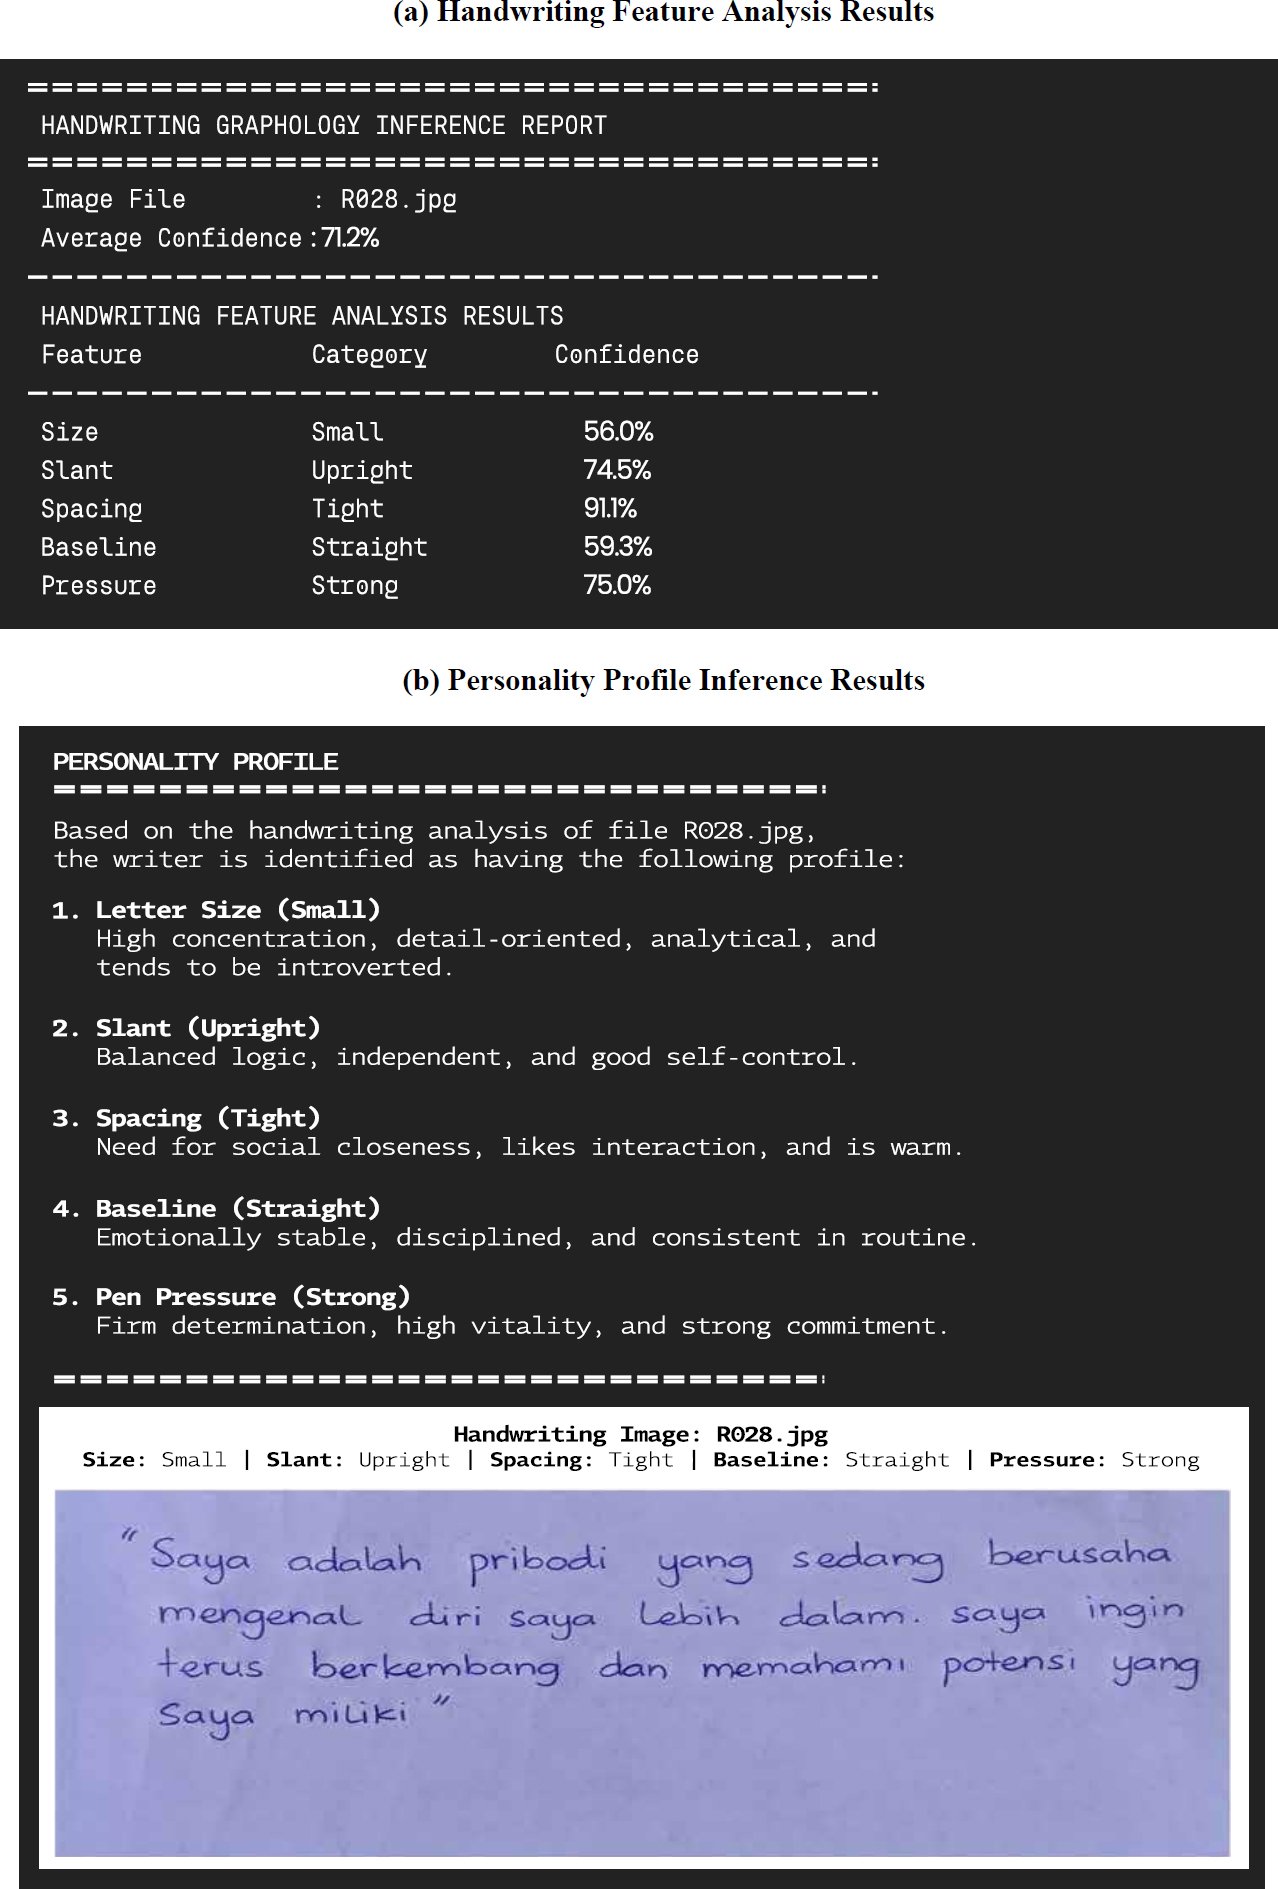
Fig. (6). Example of personality profile inference results for sample R028.jpg.
Based on the combination of these five features, the system concluded that the writer is an individual who shows high concentration, is detail-oriented and analytical, and tends to be introverted; has balanced logic, is independent, and has good self-control; needs social closeness, likes interaction, and is warm; is emotionally stable, disciplined, and consistent in routine; and shows firm determination, high vitality, and strong commitment. It should be emphasized that this inference result is an interpretation based on the graphology principles used, not a psychological diagnosis, and is deterministic, meaning that the same combination of features will always produce the same personality description. The rule-based approach offers the advantage of transparency and ease of verification of every system decision by users and graphology experts alike [29], but is entirely dependent on the completeness and quality of the rule base constructed from expert knowledge [30].
3.2. Verification of the Combinatorial Output Space
As stated in the Abstract, the combination of three Size categories, three Slant categories, two Spacing categories, three Baseline categories, and two Pressure categories yields 3 × 3 × 2 × 3 × 2 = 108 distinct personality profile combinations, each obtained by concatenating the corresponding rule statements from Table 4 in the same manner illustrated for sample R028.jpg above. To make this claim verifiable rather than asserted, Table 8 lists six of the 108 combinations, selected to span the range of the five features, together with the composite personality description each one produces.
Table 8. Sample of generated personality profile combinations (6 of 108).
| No | Size | Slant | Spacing | Baseline | Pressure | Composite Personality Description |
| 1 | Large | Right Slant | Wide | Ascending | Strong | The writer has high self-confidence, is extroverted, and enjoys being the center of attention; is expressive, future-oriented, and easily shows emotions; values personal space and has strong independence; is optimistic, ambitious, and has positive energy; and has firm convictions, high vitality, and strong commitment. |
| 2 | Large | Upright | Tight | Straight | Strong | The writer has high self-confidence, is extroverted, and enjoys being the center of attention; prioritizes logic, is independent, and has good self-control; needs social closeness, enjoys interacting, and is warm; is emotionally stable, disciplined, and consistent in routine; and has firm convictions, high vitality, and strong commitment. |
| 3 | Medium | Right Slant | Tight | Straight | Weak | The writer is adaptable, socially balanced, and flexible; is expressive, future-oriented, and easily shows emotions; needs social closeness, enjoys interacting, and is warm; is emotionally stable, disciplined, and consistent in routine; and is highly empathetic, flexible, and dislikes being forced. |
| 4 | Medium | Left Slant | Wide | Ascending | Strong | The writer is adaptable, socially balanced, and flexible; restrains emotions, is self-protective, and cautious; values personal space and has strong independence; is optimistic, ambitious, and has positive energy; and has firm convictions, high vitality, and strong commitment. |
| 5 | Small | Upright | Wide | Ascending | Weak | The writer shows high concentration, is meticulous and analytical, and tends to be introverted; prioritizes logic, is independent, and has good self-control; values personal space and has strong independence; is optimistic, ambitious, and has positive energy; and is highly empathetic, flexible, and dislikes being forced. |
| 6 | Small | Left Slant | Tight | Descending | Weak | The writer shows high concentration, is meticulous and analytical, and tends to be introverted; restrains emotions, is self-protective, and cautious; needs social closeness, enjoys interacting, and is warm; tends toward mental fatigue, pessimism, or lack of motivation; and is highly empathetic, flexible, and dislikes being forced. |
Because each of the five features is classified independently and the 13 rules in Table 4 are applied deterministically, every one of the 108 possible feature combinations not only the six shown here maps to a unique, reproducible composite description in the same way; the full set was generated programmatically from Table 4 to confirm that no combination is left unmapped or produces a duplicate description.
4. DISCUSSION
The performance of the model allowed an average accuracy rate of 73.00%, representing a 15 percentage points increase from the previous model proposed by the author, where a CNN model was used to classify the nine Enneagram personality types straight from handwritten images. This gain supports the study’s central methodological decision: training the model’s target output to five directly verifiable graphological features (size, slant, spacing, baseline, and pressure) rather than attempting an end-to-end leap from handwriting to a specific personality typology. It is because each of these five characteristics has a clear literature based operational definition and can be independently checked against the handwriting image, the resulting classification is easier for the model to learn and easier for a human evaluator to audit than a single abstract personality label would be.
On the other hand, the significant gap between raw accuracy and balanced accuracy across rates for all five features suggests that the 73.00% figure must be interpreted carefully. The high accuracy rates (90.00% and 80.00%, respectively) in the case of spacing and pressure respectively, largely because their label distributions were themselves highly imbalanced in the collected dataset (95.0% Tight spacing, 76.0% Strong pressure); once class imbalance is accounted for, spacing’s balanced accuracy falls to 50.00%, indicating that the model was, in effect, defaulting to the majority class rather than genuinely discriminating between categories. Slant and baseline, which are inherently continuous and highly variable between and within individual writers, proved hardest to classify (55.00% and 75.00% accuracy, with correspondingly low balanced accuracy of 33.33% and 40.28%), reinforcing the idea that features with fuzzy or overlapping category boundaries remain the weakest link in an automated graphology pipeline, regardless of the strength of the underlying transfer-learning backbone. Table 7 reports per-class precision, recall, and F1-score computed directly from the confusion matrices in Fig. (5), together with the resulting macro-average F1-score for each feature (60.25% for size, 23.66% for slant, 47.37% for spacing, 40.28% for baseline, and 60.78% for pressure). Such figures further support and clarify the pattern already visible in balanced accuracy: for spacing, the minority Wide class receives a precision, recall, and F1-score of 0.00%, which indicates that the model never once predicted that class on the test set, while the majority Tight class alone drives the reported 90.00% accuracy. Slant shows the same collapse for both Right Slant and Left Slant, whose precision, recall, and F1-score are all 0.00%, so the model’s apparent 55.00% accuracy is produced entirely by defaulting to the Upright class.While Pressure and baseline show a milder version of the same effect, with the minority Weak (F1 = 33.33%) and Descending (F1 = 0.00%) classes trailing well behind their majority counterparts. These findings indicate that MobileNetV2-based transfer learning is a technically feasible foundation for graphological feature classification, but that the current 100-image, 80:20-split dataset is not yet large or balanced enough to fully exploit that architecture, particularly for features with three-way category splits such as slant and baseline. The concrete example R028.jpg illustrates this limitation concretely: the lowest per-feature confidence in that inference (41.6%, for baseline) corresponded to the feature with the lowest balanced accuracy in the aggregate evaluation, showing that the model’s uncertainty on individual samples is broadly consistent with its documented weaknesses at the dataset level rather than being random noise.
The inference mechanism created on top of the two classifications offers a deliberate trade-off: because its 13 IF-THEN rules are hand-derived from established graphology literature rather than learned from data, every personality statement the system produces can be traced back to a specific feature label and a specific rule, which is valuable in contexts such as recruitment screening or forensic document examination where the reasoning behind a decision may need to be explained or challenged. However, the downside is that the system’s ceiling is set entirely by the completeness and correctness of the expert-authored rule base; any gap or oversimplification in the 13 rules will directly affect the personality profile, regardless of how accurately the underlying MobileNetV2 classifications perform. It is therefore important to reiterate, as in the case study above, that the resulting profiles are graphology-based interpretations rather than validated psychological diagnoses. Moreover it is necessary to point out this transparency applies to the rule-based inference layer itself, in which every rule and its triggering condition can be viewed ; the underlying MobileNetV2 classification stage is a fairly opaque part of deep learning technology, and this study does not yet examine which regions of a handwriting image drive each feature prediction; opening this part of the pipeline to inspection is left as a direction for future research rather than addressed in the present study.
LIMITATIONS AND FUTURE DIRECTIONS
Several limitations of the present study should be considered when interpreting these results. The dataset of 100 handwriting samples, split into training, validation, and test subsets of limited size (as few as 8 validation and 20 test images per feature), constrains how confidently the reported accuracies generalize beyond this specific sample of respondents; the pronounced class imbalance in several features further means that reported gains in raw accuracy may not translate into equally reliable performance on underrepresented categories such as Wide spacing or Weak pressure. The handwriting samples were also collected from a single writing task (one paragraph of directed sentences) in a single script, so the system’s performance on other writing tasks, languages, or scripts remains untested. In addition, while performance was initially estimated from a single 80:20 stratified train-test split, the Stratified 5-Fold Cross-Validation reported in Table 3 shows that the resulting mean estimates carry considerable fold-to-fold variability, particularly for the spacing feature (Macro F1-score standard deviation of 20.65 percentage points), so even the cross-validated figures should be read as estimates with a wide uncertainty band on a dataset of this size rather than as precise population parameters; a larger dataset would be needed to tighten these confidence intervals further. Finally, the ground-truth labels used to train and evaluate the model were themselves generated automatically by the OpenCV-based measurement rules described earlier rather than being assigned or verified by a human graphologist; while these rules are grounded in the same literature-based thresholds used throughout the study, any systematic bias in the automatic measurements would propagate directly into the reported accuracies. This is a limitation the present study is not able to resolve internally validating the OpenCV labels against expert graphological judgment requires access to one or more trained graphologists to manually annotate a subset of the handwriting images, and no such access was available within the scope and timeline of this study. Rather than leave this as an unaddressed gap, a concrete validation protocol is specified here for future work: a random stratified sample of at least 20-30 images (drawn to include examples from every category of every feature, particularly the minority classes such as Wide spacing and Descending baseline) would be independently labeled by at least two graphologists working from the same five feature definitions used in this study, blind to the OpenCV-generated labels; Cohen’s Kappa would then be computed separately for each of the five features between (a) the two human raters, to establish an inter-rater reliability ceiling for human judgment on this task, and (b) each human rater and the corresponding OpenCV label, to quantify auto-labeling agreement. Following the conventional interpretation bands for Kappa (values below 0.20 indicating slight agreement, 0.21-0.40 fair, 0.41-0.60 moderate, 0.61-0.80 substantial, and above 0.80 almost perfect agreement), a Kappa below the moderate range between OpenCV labels and human raters would indicate that the automatic thresholds require recalibration or that the corresponding feature needs a revised, less rigid operational definition, whereas at or above the moderate range would support treating the existing OpenCV labels as a reasonable approximation of expert judgment. Executing this protocol is identified as a priority next step before the auto-labeling pipeline is applied to any larger future dataset.
A related question is whether the same pipeline could be extended to classify handwriting directly into the 16 Myers-Briggs Type Indicator (MBTI) categories, defined by four dichotomies (Extraversion–Introversion, Sensing–Intuition, Thinking–Feeling, and Judging–Perceiving). There is precedent for such a link: Gagiu and Sendrescu [1] correlated handwriting features extracted by CNNs with MBTI indicators and reported prediction accuracies of 83–91% for the resulting types. However, extending the present system to output MBTI types is not simply a matter of relabeling the existing 108 combinations, because the current 13-rule base in Table 4 was authored to describe general personality traits from graphology literature and was never designed or validated against the four MBTI dichotomies specifically; none of its rules were written with a Sensing–Intuition or Judging–Perceiving distinction in mind. A scientifically sound MBTI classification would at least include an expertly developed mapping from the five graphological features (or an expanded feature set) to each of the four dichotomies grounded in graphology literature, followed by empirical validation against respondents’ actual MBTI results. Since the current research did not collect such a mapping or MBTI ground truth from its 100 respondents, no MBTI classification results are reported here; doing so without that validation step would risk presenting an unverified relabeling as if it were a tested capability. Extending the system toward the 16 MBTI types along the lines demonstrated in [1] is therefore identified as a concrete direction for future work rather than a result of the current study.
However, future research should focus on enhancing the dataset, whether through targeted collection of underrepresented categories or through more aggressive data augmentation strategies, since several of the weaknesses identified above trace back to limited and imbalanced training data rather than to the MobileNetV2 architecture itself. Beyond dataset improvements, useful next steps include benchmarking alternative backbones (e.g., ResNet or EfficientNet variants) against MobileNetV2 on the same task, extending the Stratified 5-Fold Cross-Validation reported in Table 3 to 10-fold or repeated cross-validation once a larger dataset is available in order to tight the wide fold-to-fold variability observed for the spacing feature, carrying out the Cohen’s Kappa validation protocol specified in the Discussion to formally quantify agreement between the OpenCV-generated feature labels and expert graphologist judgment (and correcting the auto-labeling thresholds if that agreement proves weak), and having practicing graphologists review and, where necessary, refine the 13-rule inference base. Comparing the system’s personality profiles against independent assessments from human graphologists or established personality inventories would also help establish external validity beyond the internal, rule-based consistency demonstrated in this study. Reporting confidence intervals or repeated experimental runs alongside the per-class precision, recall, and F1-score already presented in Table 7 would further demonstrate the stability of these performance figures.
CONCLUSION
The study was able to develop an automatic OpenCV-based graphological feature extraction system capable of successfully processing all 100 handwriting images into labels for five graphological features (size, slant, spacing, baseline, and pressure), ready to be used as model training data. The use of MobileNetV2 model in combination with two-stage transfer learning, data augmentation, and class weighting gave 73% raw accuracy on a single 80:20 stratified split, which is 15 percentage points over an unpublished version of the system (58%), and this was confirmed by Stratified 5-Fold Cross-Validation, which produced a comparable mean raw accuracy of 68.60%. However, raw accuracy alone overstates how well the system performs: averaged across the five folds, mean Balanced Accuracy was only 44.58% and mean Macro F1-score only 39.03%, and per-class inspection (Table 7) it can be seen that the model collapses to predicting only the majority class for several minority categories, most notably achieving 0% F1-score on the Right Slant and Left Slant minority classes, the Wide spacing class, and the Descending baseline class. This class collapse, as opposed to the reported accuracy rate is the key and most important finding of this study’s evaluation: the system is technically capable of learning graphological patterns from handwriting images, but on the present 100-image dataset it does so reliably only for the majority category of each feature, and the slant and baseline features in particular remain close to random-guessing performance once class imbalance is accounted for (Balanced Accuracy of 36.90% and 37.56% respectively in the cross-validated results). These features are also inherently more continuous and harder to recognize than the others, and their weakest classes are constrained by very few available training samples, both of which compound the class-collapse problem documented above.
A personality inference system based on 13 IF-THEN rules was successfully designed to map the classification results of the five graphological features into up to 108 unique, transparent, and consistent personality profile combinations. The three components OpenCV-based feature extraction, MobileNetV2 classification, and rule-based inference were successfully integrated into a single end-to-end pipeline from handwriting image to personality profile report. The main limitation of this study is the class collapse documented through Stratified 5-Fold Cross-Validation and confirmed at the per-class level (Tables 3 and 7): The still-limited dataset size and the imbalanced class distribution leave several graphological features, particularly slant and baseline, performing close to random guessing once Balanced Accuracy and Macro F1-score are examined rather than raw accuracy alone. Further research is recommended to increase the amount and diversity of the dataset with a more balanced class distribution, formally validate the OpenCV auto-generated labels against expert graphologist judgment using the Cohen’s Kappa protocol specified in the Discussion, expand the range of graphological features analyzed, compare the performance of MobileNetV2 with other deep learning architectures, and develop an inference mechanism that can take into account the confidence level of classification results.
LIST OF ABBREVIATIONS
| AI | = | Artificial Intelligence |
| CNN | = | Convolutional Neural Network |
| MBTI | = | Myers-Briggs Type Indicator |
| ROI | = | Region of Interest |
| ResNet | = | Residual Network |
| SD | = | Standard Deviation |
| SVM | = | Support Vector Machine |
| TL | = | Transfer Learning |
| VGG | = | Visual Geometry Group |
AUTHOR’S CONTRIBUTION
P.S. contributed to data collection, data analysis and interpretation, and manuscript writing. D.P. contributed to the conceptualization and design of the study, as well as manuscript writing. A.B.A. contributed to data analysis and interpretation.
ETHICAL APPROVAL & INFORMED CONSENT
Not applicable.
AVAILABILITY OF DATA AND MATERIALS
The data will be made available on reasonable request by contacting the corresponding author [D.P.].
FUNDING
None.
CONFLICT OF INTEREST
The authors declare no conflicts of interest.
ACKNOWLEDGEMENTS
The authors would like to thank the Informatics Study Program, Faculty of Industrial Technology, Universitas Trisakti, for the facilities and academic environment provided throughout this research. The authors also extend their appreciation to the supervising lecturer for the guidance, mentorship, and valuable input provided throughout the research and writing process of this article. Thank you are also extended to all respondents who kindly took the time to provide handwriting samples as the primary data for this study.
DECLARATION OF AI
AI-assisted tools were used solely for manuscript enhancement, including language improvement and editorial refinement. All AI-assisted modifications were carefully reviewed and verified, and full responsibility for the accuracy, originality, and integrity of the final manuscript is accepted.
REFERENCES
[1] D. Gagiu and D. Sendrescu, “Detection of Personality Traits Using Handwriting and Deep Learning,” Appl. Sci., vol. 15, no. 4, pp. 2154, 2025,
https://doi.org/10.3390/app15042154
[2] I. Awaludin and A. Khairunisa, “Aplikasi Grafologi dari Huruf ‘t’ Menggunakan Jaringan Syaraf Tiruan,” 2015, Available from: https://www.semanticscholar.org/paper/Aplikasi-Grafologi-dari-Huruf-%E2%80%9Ct%E2%80%9D-Menggunakan-Awaludin-Khairunisa/2f046ea780dd11ebb55b30a38b3a229645115505#citing-papers
[3] D. Pratiwi, G. B. Santoso, and F. H. Saputri, “the Application of Graphology and Enneagram Techniques in,” J. Comput. Sci. Inf., vol. 10, no. 1, pp. 11–18, 2017,
https://doi.org/10.21609/jiki.v10i1.372
[4] N. Ullah, F. Guzmán-Aroca, F. Martínez-Álvarez, I. De Falco, and G. Sannino, “A novel explainable AI framework for medical image classification integrating statistical, visual, and rule-based methods,” Med. Image Anal., vol. 105, Art. no. 103665, 2025,
https://doi.org/10.1016/j.media.2025.103665
[5] S. B. Tumpa and K. K. Halder, “A Comparative Study on Different Transfer Learning Approaches for Identification of Plant Diseases,” in 2023 International Conference on Next-Generation Computing, IoT and Machine Learning (NCIM), Los Alamitos, CA, USA: IEEE, pp. 1–6. 2023, pp. 1–6,
https://doi.org/10.1109/NCIM59001.2023.10212647
[6] D. Kapoor et al., “Convolutional Neural Network-based Multi-Classification of Skin Disease with Fine-Tuned ResNet50 and VGG16,” Open Bioinforma. J., vol. 18, no. 1, pp. 1–23, 2025,
https://doi.org/10.2174/0118750362387304250716055022
[7] T. Chen, G. Li, P. Li, L. Zhang, Z. Yang, and Q. Wang, “Four-channel convolutional Chinese handwriting recognition based on MobileNetV2,” in International Conference on Electronic Information Engineering and Data Processing (EIEDP 2023), Z. H. Khan and V. E. Balas, Eds., SPIE, vol. 12700, 2023,
https://doi.org/10.1117/12.2682349
[8] K. E. Lestari, S. Winarni, A. Prihandhika, E. S. Nugraha, and M. R. Yudhanegara, “Neurocognitive prediction of dyslexic handwriting pattern using an explainable AI-driven custom litebinarynet-CNN,” Commun. Math. Biol. Neurosci., vol. 2025, 2025,
https://doi.org./10.28919/cmbn/9635
[9] Y. Gulzar, “Fruit Image Classification Model Based on MobileNetV2 with Deep Transfer Learning Technique,” Sustain., vol. 15, no. 3, Art. no. 1906, 2023,
https://doi.org/10.3390/su15031906
[10] K. Tyagi and K. Sharma, “A Comparative Review of Lightweight Machine Learning Approaches for Handwriting-Based,” In Proceedings of the 2025 7th Asia Conference on Machine Learning and Computing (ACMLC ’25). Association for Computing Machinery, New York, NY, USA, pp. 81 – 86, 2025,
https://doi.org/10.1145/3772673.3772675
[11] A. Daood, A. L. I. Al-saegh, and A. F. Mahmood, “Handwriting detection and recognition of arabic numbers and characters using deep learning methods,” J Engi. Sci. Tech., vol. 18, no. 3, pp. 1581–1598, 2023, Available from: https://www.researchgate.net/publication/371349448_HANDWRITING_DETECTION_AND_RECOGNITION_OF_ARABIC_NUMBERS_AND_CHARACTERS_USING_DEEP_LEARNING_METHODS
[12] H. N. Champa and K. R. AnandaKumar, “Automated human behavior prediction through handwriting analysis,” Proc. – 1st Int. Conf. Integr. Intell. Comput. ICIIC 2010, pp. 160–165, 2010,
https://doi.org/10.1109/ICIIC.2010.29
[13] S. Ghosh, P. Shivakumara, P. Roy, U. Pal, and T. Lu, “Graphology based handwritten character analysis for human behaviour identification,” CAAI Trans. Intell. Technol., vol. 5, no. 1, pp. 55–65, 2020,
https://doi.org/10.1049/trit.2019.0051
[14] D. Jain, “Identification of violent behavior using Handwriting,” Int. J. Adv. Trends Comput. Sci. Eng., vol. 9, no. 4, pp. 6238–6250, 2020,
https://doi.org/10.30534/ijatcse/2020/303942020
[15] S. P. Deore, “Human Behavior Identification Based on Graphology Using Artificial Neural Network,” Acadlore Trans. AI Mach. Learn., vol. 1, no. 2, pp. 101–108, 2022,
https://doi.org/10.56578/ataiml010204
[16] Samsuryadi, R. Kurniawan, J. Supardi, Sukemi, and F. S. Mohamad, “A Framework for Determining the Big Five Personality Traits Using Machine Learning Classification through Graphology,” J. Electr. Comput. Eng., vol. 2023, Art. no. 1249004, 2023,
https://doi.org/10.1155/2023/1249004
[17] F. Sheikh, A. Al Marouf, J. G. Rokne, and R. Alhajj, “Lightweight Deep Learning Models with Explainable AI for Early Alzheimer’s Detection from Standard MRI Scans,” Diagnostics, vol. 15, no. 21, Art. no. 2709 2025,
https://doi.org/10.3390/diagnostics15212709
[18] A. Géron, “Hands-on Machine Learning with Scikit-Learn,” Keras & TensorFlow. pp. 856, 2019,
https://dl.acm.org/doi/10.5555/3378999
[19] K. K. Dobbin and R. M. Simon, “Optimally splitting cases for training and testing high dimensional classifiers,” BMC Med. Geno., vol. 4, Art. no. 31, 2011,
https://doi.org/10.1186/1755-8794-4-31
[20] D. Impedovo, S. Member, G. Pirlo, and S. Member, “Dynamic handwriting analysis for the assessment of neurodegenerative diseases: a pattern recognition perspective,” in IEEE Reviews in Biomedical Engineering vol. 12, pp. 209-220, 2019,
https://doi.org/10.1109/RBME.2018.2840679
[21] M. Sandler, A. Howard, M. Zhu, and A. Zhmoginov, “MobileNetV2: Inverted Residuals and Linear Bottlenecks,” 2018 IEEE/CVF Conference on Computer Vision and Pattern Recognition, Salt Lake City, UT, USA, pp. 4510–4520, 2018,
https://doi.org/10.1109/CVPR.2018.00474
[22] I. Science, “Using Handwriting Features to Predict Student Performance in IT and Engineering Domain,” pp. 1–9, 2022, Available from: https://cse.aua.am/wp-content/uploads/2023/12/Naira-Khachatryan_BS-Data-Science_Capstone-Research-Project.pdf
[23] J. M. Johnson and T. M. Khoshgoftaar, “Survey on deep learning with class imbalance,” J. Big Data, vol. 6, Art. no. 27, 2019,
https://doi.org/10.1186/s40537-019-0192-5
[24] N. AL-Qawasmeh, M. Khayyat, and C. Y. Suen, “Age detection from handwriting using different feature classification models,” Pattern Recognit. Lett., vol. 167, pp. 60–66, 2023,
https://doi.org/10.1016/j.patrec.2023.02.001
[25] M. Gavrilescu, “Predicting the Big Five personality traits from handwriting,” J Image Video Process. vol. 2018, Art. no. 57, 2018,
https://doi.org/10.1186/s13640-018-0297-3
[26] C. De Stefano, F. Fontanella, D. Impedovo, G. Pirlo, and A. Scotto, “Handwriting analysis to support neurodegenerative diseases diagnosis: A review,” Pattern Recognit. Lett., vol. 121, pp. 37-45, 2019,
https://doi.org/10.1016/j.patrec.2018.05.013
[27] B. Moysset and R. Messina, “Are 2D-LSTM really dead for offline text recognition?,” Int. J. Docu. Anal. Recog., vol. 22, pp. 193-208, 2019,
https://doi.org/10.1007/s10032-019-00325-0
[28] H. He and E. A. Garcia, “Learning from Imbalanced Data,” in IEEE Transactions on Knowledge and Data Engineering, vol. 21, no. 9, pp. 1263–1284, 2009,
https://doi.org/10.1109/TKDE.2008.239
[29] T. Kliegr and J. Fürnkranz, “A review of possible effects of cognitive biases on interpretation of rule-based machine learning models,” Artif. Intell., vol. 295, Art. no. 103458, 2021,
https://doi.org/10.1016/j.artint.2021.103458
[30] A. B. Arrieta et al., “Explainable Artificial Intelligence (XAI): Concepts, Taxonomies, Opportunities and Challenges toward Responsible AI,” Infor. Fus., vol. 58, pp. 82-115, 2020,
https://doi.org/10.1016/j.inffus.2019.12.012
Licensed
© 2026 Copyright by the Authors.
Licensed as an open access article using a CC BY 4.0 license.
Article Contents Author Nasir Uddin Khan1, * 1Department of Emaan Institute of Management Sciences, Karachi, Pakistan Article History: Received: 16
Article Contents Authors Putri Syabillah1 , Dian Pratiwi1, * , Anung Barlianto Ariwibowo1 1Department of Informatics Engineering, Universitas Trisakti, Jakarta,
Article Contents Author Srigopal Mohanty1, * 1Siksha O Anusandhan University, Bhubaneswar, India Article History: Received: 01 July, 2026 Accepted: 03
Article Contents Author Arslan Sheikh1, * 1COMSATS University Islamabad, Islamabad Campus, Islamabad, Pakistan Article History: Received: 22 February, 2026 Accepted:
Article Contents Author Wahaj Anees1, * 1Department of Forensic Sciences, Institute of Basic Medical Sciences- Khyber Medical University, Peshawar, Pakistan
Article Contents Author Danish Rahman1, * Matias Garcia-Constantino1 1School of Computing, Ulster University, Belfast Campus, BT151AP, United Kingdom Article History: