



















Article Contents
Article ID: CM2601105005
Views: 669Use of Wearable Devices to Detect Sedentary Behaviour in an Office Environment
 DOI:
DOI:
 PDF
PDF
⬇ Downloads: 16
1School of Computing, Ulster University, Belfast Campus, BT151AP, United Kingdom
Received: 23 February, 2026
Accepted: 22 July, 2026
Revised: 19 June, 2026
Published: 28 March, 2026
Abstract:
Introduction: Sedentary Behaviour (SB) is a significant public health problem associated with chronic illness, poorer quality of life, and increased healthcare costs. Fitbit-type wearable devices provide continuous monitoring of activity, heart rate, and sleep, creating an opportunity to detect sedentary behaviour in office-based and free-living contexts.
Methodology: This study presents an interpretable, subject-aware, and prototype-oriented SB detection framework using a public Fitbit dataset. Five supervised ML models (Logistic Regression, SVM, KNN, Random Forest, and XGBoost), two baseline DL models (FNN and LSTM), and exploratory 1D-CNN and CNN-LSTM sequence models were evaluated using leakage-safe, subject-independent validation. Activity, sleep, heart rate, step intensity, engineered, and subject-normalised features were considered, with SHAP used for explainability.
Results: Under participant-grouped five-fold cross-validation, XGBoost achieved the strongest aggregate binary results, with accuracy 0.9366 ± 0.0183, macro-F1 0.8082 ± 0.0333, balanced accuracy 0.7962 ± 0.0577, ROC-AUC 0.9203 ± 0.0430, and PR-AUC 0.9890 ± 0.0091. Threshold sensitivity supported the 600-minute cut-off because it produced the highest macro-F1 and balanced accuracy, while participant-level bootstrap intervals quantified uncertainty around the estimates.
Conclusion: The revised framework also includes a Streamlit prototype that supports Fitbit CSV upload, automated preprocessing, probability-based sedentary risk scoring, low/moderate/high risk interpretation, and SHAP-based explanations. It is a research prototype rather than a validated workplace deployment. The results show that tree-based ML models remain more reliable than sequence-based DL models for this small and imbalanced Fitbit dataset, while the interface provides a route for further evaluation.
Keywords: Sedentary behaviour detection, wearable devices, physical activity monitoring, machine learning, deep learning, subject-independent validation, multimodal ablation, explainable AI, sedentary risk scoring, regression modelling.
1. INTRODUCTION
Sedentary Behaviour (SB) is any waking activity that involves sitting, reclining, or lying that involves little energy expenditure (≤1.5 METs (Metabolic Equivalents)) [1, 2]. It is becoming an increasingly recognised serious cause of concern in public health, with prolonged SB associated with cardiovascular disease, obesity, musculoskeletal disorders, type 2 diabetes, some forms of cancer, and premature mortality. [3–10]. Modern office environments exacerbate this problem, as workers spend most of their working life in a seated position and contribute significantly to daily sedentary time [6, 11–13].
Early detection and regular monitoring of SB are the key to designing interventions and encouraging active lifestyles. Traditional methods, such as self-reports and observational studies, tend to have problems with recall bias, limited resolution, and scalability. In contrast, wearable devices such as Fitbit allow us to have continuous, objective, and fine-grained measures of activity, heart rate, and sleep in free-living conditions [12, 14–18]. Open datasets such as the Fitbit collection on Kaggle used for this paper enable the development and validation of ML and DL models for SB detection [15, 19–23]. Prior research shows that multimodal features combining activity, physiological, and sleep data improve classification accuracy compared with step counts alone [19, 24, 25].
This paper presents a revised SB detection framework based on the Kaggle Fitbit dataset. Five ML models are compared with TensorFlow/Keras-based DL approaches, and the evaluation is strengthened through subject-independent splitting, grouped cross-validation, leakage-safe ROC-AUC and PR-AUC calculation, threshold sensitivity testing, modality-wise ablation, three-level classification, regression-based sedentary-time prediction, and bootstrapped confidence intervals.
The contribution of the study is system-level integration rather than algorithmic innovation. It combines multimodal Fitbit-derived features, subject-aware validation, engineered and subject-normalised features, explainability, and a Streamlit risk-scoring prototype within a single leakage-controlled workflow. The contribution is therefore an integrated evaluation and interpretation pipeline rather than a new learning algorithm.
The remainder of this paper is organised as follows: Section 2 reviews the literature related to the areas of the use of wearable devices and DL in Activity Recognition in the context of SB; Section 3 details the proposed methodology; Section 4 presents the results obtained; Section 5 describes the application developed and concludes with recommendations for future research.
2. LITERATURE REVIEW
2.1. Sedentary Behaviour: Definition, Risks, and Measurement Challenges
Sedentary Behaviour (SB) generally refers to waking activities that involve sitting, reclining, or lying down, with energy expenditure no greater than 1.5 METs [1, 2]. Spending long periods inactive has been linked to a range of health issues, such as heart disease, obesity, type 2 diabetes, musculoskeletal disorders [3–10, 26], and a heightened risk of early death. Sitting for long periods is common in most workplaces and contributes strongly to the overall sitting time of the day.
While conventional methods like self-report surveys are subjective and subject to recall bias, direct observation is time-consuming and impractical for use at scale [11, 12, 27, 28]. Ongoing and dependable monitoring of posture and movement is possible with objective device-based techniques, such as accelerometers and inclinometers. But many of these tools are research quality and require expensive specialised knowledge to process the data. Consumer wearables like the Fitbit, on the other hand, are designed to offer a more readily available way to monitor in large populations, one that is cheap, widely used, and reasonably accurate [17, 18].
2.2. Wearable Devices and Fitbit in Sedentary Behaviour Detection
Devices such as Fitbit constantly collect different types of data [17–18, 23, 29–31], such as steps, heart rate, activity levels, and sleep patterns. Several studies have confirmed the accuracy of Fitbit in step detection [17, 21, 22, 29] and activity classification, showing similar performance to research-grade accelerometers, hence confirming its suitability for large-scale research applications [12, 13, 32].
Shrestha et al. [11] emphasised the importance of integrating various behavioural measures to obtain a more comprehensive picture of SB in workplace health studies. Similarly, Bongers et al. [12] determined that Fitbit was a reasonable and practical tool [20, 23, 24] for measuring SB over prolonged periods in the workplace. More recently, in their study, Wang et al. [15] also showed that step count data from Fitbit can be used effectively in Machine Learning models for classifying SB, and the results were similar and comparable with high-end accelerometers.
2.3. Machine Learning Approaches to SB Classification
A variety of Machine Learning algorithms (Random Forest, Support Vector Machines (SVMs), XGBoost, K-Nearest Neighbour (KNN), and Logistic Regression) have been strongly employed in the analysis of data from wearable devices for the detection of Sedentary Behaviour (SB) [15–16, 19, 33–36]. These are useful when used for structured data like daily steps, minutes of activity, or heart rate measurements, and sleep data, etc.
Kańtoch [16] reported high accuracy in recognising SB using a wearable sensor during Activities of Daily Living (ADLs), which can be further improved by using Feature Engineering. However, Papathomas et al. [19] have used gradient boosting for step count data that were measured once a day and have shown the utility of small models in predicting SB. In addition to predictive performance, another critical issue that hinders the acceptance of the products of ML for healthcare applications is interpretability. SHAP contributes to the interpretation of how each feature is involved in the model decision, which increases trust in the model [37] and increases its clinical applicability [38].
2.4. Deep Learning in Activity Recognition and SB Detection
Deep Learning techniques can extract some of the interesting patterns from raw or less processed wearable data, and can capture some complex relationships that may not be discovered by traditional ML models [39–46]. The models, such as Convolutional Neural Networks (CNNs) and Long Short-Term Memory (LSTMs), have also worked well for the recognition of human activity, which includes even the recognition of Sedentary Behaviour.
Plotz et al. [40, 41] thoroughly compared the deep, convolutional, and recurrent models on wearable sensor data and their performance improvement over traditional ML approaches. Similarly, Zhao et al. [39] compared their deep residual bidirectional LSTM for wearable sensor data, which shows their better ability to deal with time-based patterns. The results, in particular, suggest that DL models can be used for SB detection in the case of analysing data from Fitbit, where the input can be either time-series or high-dimensional.
2.5. Research Gaps
Although advancements have been made towards the detection of Sedentary Behaviour, some important gaps persist related to both Fitbit-based and office-centred detection of Sedentary Behaviour:
(i) Multimodal and engineered features: Several studies have primarily focused on the number of steps counted, and activity, sleep, heart rate, step intensity, and subject-normalised features have been analysed less frequently in combination.
(ii) Participant-level leakage and generalisation: Random record-level splitting can place records from the same participant in both training and testing sets, which may inflate performance and weaken evidence of generalisability to unseen users.
(iii) Binary-only sedentary labels: A single binary threshold is useful for interpretability, but it can oversimplify sedentary time as a continuous behaviour. Sensitivity analysis, three-level labels, and regression modelling can provide a more complete evaluation.
(iv) Limited statistical validation: Prior work often reports point estimates only. Confidence intervals, grouped cross-validation, and probability-based AUC metrics are needed to make reported performance more reliable.
(v) Practical, explainable deployment: Few studies combine leakage-safe modelling with explainability and a deployable tool that can support real-world risk interpretation for non-technical users.
3. METHODOLOGY
3.1. Dataset Description
The study used a publicly available Fitbit dataset from Kaggle [15, 20, 21]. The original dataset contains activity tracker records collected over approximately two months and is suitable as a prototype dataset for sedentary-behaviour modelling. The limited number of study participants and short data collection period suggest that the results must be viewed as exploratory and not representative of the office worker population as a whole. While subject-independent validation can eliminate participant-level leakage, it cannot take the place of external validation across workplace settings, devices, age groups or daily routines. The redesign thus aimed to provide a conservative estimate of generalizability.
The main files used in the workflow were dailyActivity_merged.csv, sleepDay_merged.csv, heartrate_ seconds_merged.csv, and minuteStepsNarrow_merged.csv. These files included the sum of all activities performed each day, the number of minutes slept, observation of the HR at step level 2, and the number of steps taken per minute of activity, respectively.
This table 1 is a summary of the feature groups that were used in the updated multimodal framework. It breaks down raw Fitbit variables, engineered indicators, subject-normalised variables, and outcome variables to explain how leakage was handled:
Table 1 presents the dataset features and modalities used in the revised framework:
Table 1. Dataset features and modalities used in the revised framework.
| Feature group | Included Variables and Modelling Role |
| Activity | TotalSteps, TotalDistance, active minutes, and Calories; movement volume and energy expenditure. |
| Sleep | Sleep records, minutes asleep, time in bed, and SleepEfficiency; rest and recovery context. |
| Heart rate | AvgHeartRate, HRPerStep, and HRPerActiveMinute; cardiovascular response relative to movement. |
| Intensity | AvgStepsPerMinute, MVPA_Minutes, MVPA_Ratio, and ActivityIntensityScore; daily intensity profile. |
| Subject-normalised | Participant-level deviation/Z-score features; within-person change relative to baseline. |
| Outcome only | Binary label, three-level label, and SedentaryMinutes_Raw; targets excluded from classification inputs. |
The feature design represents a system-level integration of activity, sleep, heart rate, intensity, and participant-relative information. Target variables were kept outside the classification inputs to maintain leakage control.
3.2. Data Preprocessing and Feature Engineering
The Fitbit files were standardised with cleaning of date fields and merging by participant and day. To summarise cardiovascular activity and steps intensity, the daily average heart rate and average steps per minute were calculated. Activity data was treated conservatively in the case of gaps, and the raw SedentaryMinutes data was kept only to create the labels and regression.
The updated features are the standard Fitbit metrics like TotalSteps, TotalDistance, VeryActiveMinutes, FairlyActive Minutes, LightlyActiveMinutes, Calories, TotalSleepRecords, TotalMinutesAsleep, and TotalTimeInBed, plus AvgHeartRate and AvgStepsPerMinute. Additional engineered features were added to increase novelty and multimodal fusion, such as TotalActiveMinutes, MVPA_Minutes, MVPA_Ratio, Light ActivityRatio, ActivityIntensityScore, CaloriesPerStep, CaloriesPerActiveMinute, SleepEfficiency, HRPerStep, and HRPerActiveMinute. Subject-normalised deviation/Z-score features were also applied to denote the nature of each day with respect to its own baseline.
To avoid label leakage, participant identifiers, date fields, SedentaryMinutes, SedentaryMinutes_Raw, and label columns were excluded from the classification input features. SedentaryMinutes_Raw was retained only as the regression target.
3.3. Sedentary Behaviour Labelling and Additional Tasks
To achieve this binary classification, the authors maintained the 600-minute threshold such that days with SedentaryMinutes greater than or equal to 600 are classified as sedentary/high-sedentary and days below 600 are classified as active/lower-sedentary. This threshold is consistent with the literature that often suggests daily sedentary time of over 8-10 hours [7–8, 47–51].
To test the robustness of the binary classification strategy, a threshold sensitivity analysis was conducted with thresholds set at 540, 600, and 660 sedentary minutes. In addition, three tiers of sedentary time (low sedentary: <300 minutes, moderate sedentary: 300-599, high sedentary: >600) were created. Sedentary Minutes_Raw was also fitted as a continuous linear regression outcome in order to directly get the estimate of sedentary time.
The pipeline in Fig. (1) below depicts the step-by-step workflow from raw Fitbit files to validated sedentary behaviour outputs. The image shows feature engineering, subject-independent validity, ML/DL/regression analysis and risk scoring based on deployment.
The revised pipeline shows that the target variable is separated from the predictor matrix before validation and modelling. This supports a leakage-safe workflow and links the experimental results to a deployable monitoring tool.
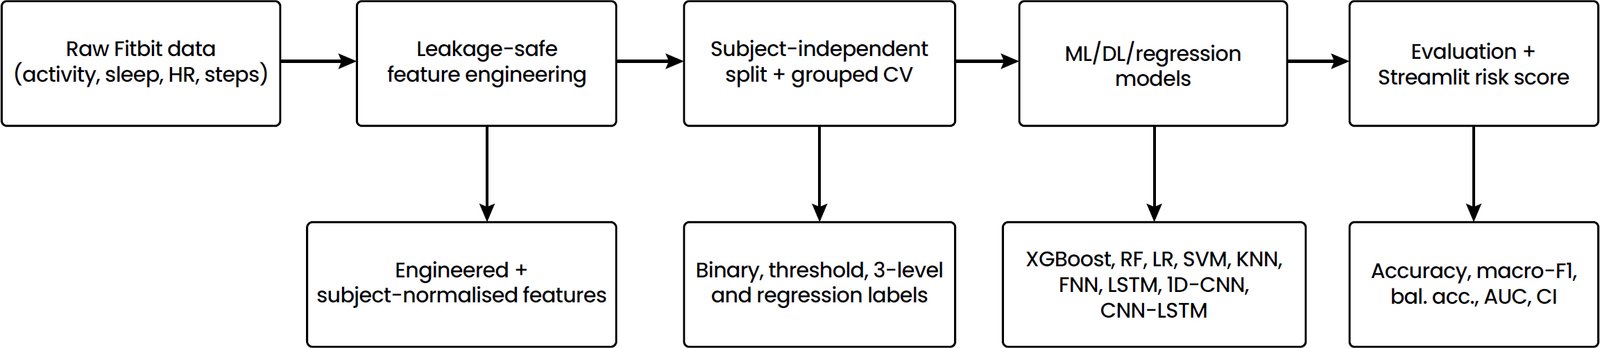
Fig. (1). Revised leakage-safe and subject-aware sedentary behaviour detection pipeline.
3.4. Subject-Independent Validation and Leakage Control
Subject-independent splitting was used in the revised evaluation. Participant ID was only used as a grouping variable to ensure that all records from the participant were grouped exclusively in either the training or testing set. Participant ID was not considered a predictor. A participant-level grouped cross-validation was also performed to get a better estimate of generalisability to unseen users.
Before model training, a leakage audit was carried out. ID fields, date fields, class labels, SedentaryMinutes, and SedentaryMinutes_Raw were not included in the classification feature matrix. ROC-AUC and PR-AUC were recalculated upon predicted probabilities instead of hard class labels for a more accurate estimation of discrimination. External replication should also be tested on established wearable datasets such as UCI HAR and PAMAP2, because their sensor protocols and activity labels differ from the Fitbit data used here [52, 53].
3.5. Machine Learning Models
Logistic Regression, Support Vector Machine (SVM), K-Nearest Neighbour (KNN), Random Forest, and XGBoost were the supervised ML models. These are linear learning, kernel-based learning, instance-based learning, and ensemble learning. Hyperparameters were optimised via cross-validation, and probability outputs were used to calculate ROC-AUC and PR-AUC if available.
3.6. Deep Learning and Regression Extensions
The Feedforward Neural Network (FNN) and LSTM models were retained as baseline DL models [54–58]. To extend the comparison, exploratory 1D-CNN and CNN-LSTM models were added using seven-day participant-level windows. These architectures were selected to provide a limited sequence-based comparison, not as fully optimised deep-learning systems, because the dataset is small, imbalanced, and represented mainly by daily aggregated features. Their results are therefore interpreted as dataset-matched evidence rather than as a general test of deep learning.
Regression modelling was also performed using Linear Regression, Support Vector Regression (SVR), Random Forest Regressor, and XGBoost Regressor to predict SedentaryMinutes_Raw as a continuous outcome.
3.7. Tools and Environments
Experiments were implemented in Python 3.10 using pandas, NumPy, scikit-learn, XGBoost, TensorFlow, Keras and SHAP, with model-interpretation choices informed by established explainability methods [59–61]. The aligned archive contained 1,397 daily records from 35 participants; 24 duplicate participant-day keys were retained and disclosed. The primary binary task used the 600-minute threshold; sensitivity analysis used 540, 600 and 660 minutes; three-level labels used <300, 300–599, and ≥600 minutes, and the classification matrix contained 42 features. Validation used five-fold StratifiedGroupKFold with shuffle=True and random_state=42, with participant identity used only for grouping. Fold-level scores and paired-test outputs were retained in the accompanying analysis package. Exact hyperparameter grids, deep-learning training settings, package-version lockfiles and run logs were not available and should accompany a future rerun for exact replication.
Reproducibility requires retaining the four input files, participant/day alignment and target-exclusion rules, the 600-minute primary threshold, the 540/600/660-minute sensitivity thresholds, the three-level cut-points, the 42-feature classification protocol, participant-grouped fold definitions, random_state=42, model and metric configuration, software versions, fold-level scores, predictions and run logs. The present rerun documents the data audit and fold structure; exact tuning grids and deep-learning training artefacts were not available in the supplied archive.
3.8. Evaluation Metrics
Accuracy, precision, recall, F1-score, Macro-F1, balanced accuracy, ROC-AUC and PR-AUC were used for classification [62–64]. Grouped-CV results are reported as mean ± standard deviation, and participant-level bootstrap 95% confidence intervals quantify uncertainty for XGBoost. For the primary binary task, scores from identical participant-held-out folds were paired. Shapiro-Wilk normality checks guided the choice between paired t-tests and Wilcoxon signed-rank tests; each comparison reports the paired mean or median difference, 95% confidence interval, effect size and Holm-adjusted p-value across five folds. Regression results are evaluated with MAE, RMSE and R², while multiclass and sequence extensions are interpreted as additional descriptive analyses.
Across the complete binary pairwise output, 49 comparisons used paired t-tests and one used a Wilcoxon signed-rank test. In the primary XGBoost-oriented comparisons, XGBoost exceeded KNN for Macro-F1 (mean Δ=0.1657; t(4)=6.655; Holm p = 0.0265) and balanced accuracy (mean Δ=0.1922; t(4)=27.551; Holm p < 0.001), and exceeded Random Forest for balanced accuracy (mean Δ=0.1138; t(4)=6.866; Holm p = 0.0165). The XGBoost–SVM Macro-F1 comparison was not significant after Holm correction (Holm p = 0.4991). The non-parametric comparison was SVM versus Random Forest PR-AUC (Wilcoxon W=5.000, p = 0.625; 95% CI [−0.0059, 0.0075]; rank-biserial r=−0.600; Holm p = 1.000). These are fold-level comparisons within the supplied dataset and are not interpreted as universal model superiority.
3.9. Application Deployment and Ethical Considerations
The Streamlit app was treated as a research prototype that supports probability-based sedentary risk scoring and low, moderate, and high-risk interpretation. It currently uses a pre-trained model for prediction and has not been validated in live office settings. Adaptive retraining and longitudinal data storage with user consent are future work. Data in this study were public and de-identified, and no personal data were collected or shared.
4. RESULTS AND DISCUSSION
4.1. Subject-Independent Binary Classification
The primary evaluation uses participant-grouped five-fold validation so that records from each participant remain within one held-out fold. Table 2 reports the single-split estimates separately for comparison.
Table 2. Single-split binary classification results.
| Model | Accuracy | Macro-F1 | Bal. Acc. | ROC-AUC | PR-AUC |
| Logistic Regression | 0.7924 | 0.6920 | 0.7657 | 0.8446 | 0.9684 |
| SVM | 0.8478 | 0.7297 | 0.7517 | 0.8526 | 0.9614 |
| KNN | 0.8789 | 0.6793 | 0.6396 | 0.7882 | 0.9313 |
| Random Forest | 0.8789 | 0.7046 | 0.6675 | 0.8449 | 0.9529 |
| XGBoost | 0.9204 | 0.8238 | 0.7853 | 0.9170 | 0.9828 |
Table 2 reports the single-split binary classification estimates, whereas Table 3 reports the participant-grouped five-fold results.
The single-split table shows the earlier XGBoost point estimates. The participant-grouped results used for the primary interpretation are reported in Table 3.
Table 3. Participant-grouped five-fold binary classification results (mean ± SD).
| Model | Accuracy | Macro-F1 | Balanced accuracy | ROC-AUC | PR-AUC |
| KNN | 0.9181 ± 0.0237 | 0.6425 ± 0.0665 | 0.6039 ± 0.0474 | 0.8257 ± 0.0521 | 0.9674 ± 0.0163 |
| Logistic Regression | 0.8515 ± 0.0711 | 0.7132 ± 0.0896 | 0.8187 ± 0.0447 | 0.8969 ± 0.0373 | 0.9844 ± 0.0087 |
| Random Forest | 0.9312 ± 0.0129 | 0.7292 ± 0.0523 | 0.6823 ± 0.0636 | 0.9110 ± 0.0553 | 0.9864 ± 0.0108 |
| SVM | 0.8841 ± 0.0274 | 0.7303 ± 0.0432 | 0.7912 ± 0.0305 | 0.8867 ± 0.0341 | 0.9844 ± 0.0061 |
| XGBoost | 0.9366 ± 0.0183 | 0.8082 ± 0.0333 | 0.7962 ± 0.0577 | 0.9203 ± 0.0430 | 0.9890 ± 0.0091 |
The following chart compares the main binary classification metrics across the evaluated ML models. It prioritises accuracy, macro-F1, and balanced accuracy as these jointly capture both overall and imbalance-aware performances.
The binary Fig. (2) shows that in terms of both accuracy and Macro-F1, XGBoost was the leading classifier, while Logistic Regression dominated in terms of balanced accuracy. This table further explains the need for imbalance-aware metrics to be reported with overall accuracy.
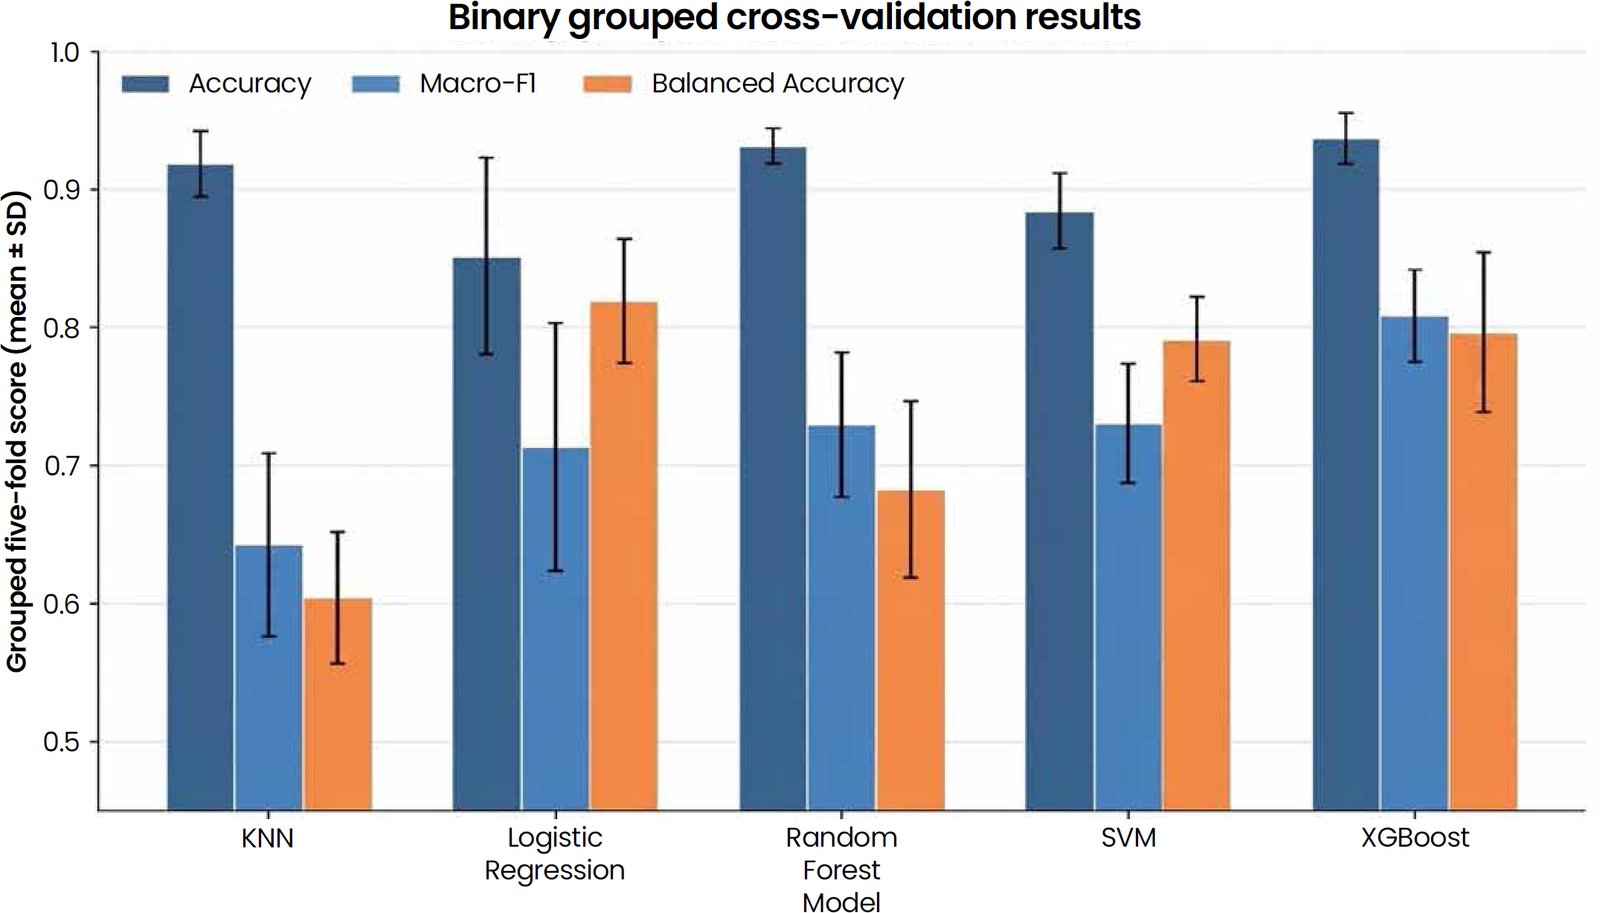
Fig. (2). Participant-grouped five-fold binary model comparison across the reported metrics.
4.2. Grouped Cross-Validation and Leakage-Safe AUC
Participant-grouped cross-validation produced XGBoost accuracy 0.9366 ± 0.0183, macro-F1 0.8082 ± 0.0333, ROC-AUC 0.9203 ± 0.0430 and PR-AUC 0.9890 ± 0.0091. Logistic Regression achieved the highest balanced accuracy (0.8187 ± 0.0447), whereas XGBoost achieved the strongest aggregate performance across the remaining primary metrics.
The grouped cross-validation table summarises model stability under participant-level grouping. Mean and standard deviation values are reported across five folds.
Table 3 presents the participant-grouped five-fold binary classification results.
The grouped-CV results show that XGBoost leads in accuracy, macro-F1, ROC-AUC and PR-AUC, while Logistic Regression records the highest balanced accuracy. The paired inferential comparisons are reported in Table 4 and the accompanying forest plot.
The paired-comparison in Fig. (3) shows that the primary XGBoost differences against the comparator models; the inferential table reports fold-level differences, normality checks, test statistics, confidence intervals, effect sizes and Holm-adjusted p-values.
The fold-level results show that XGBoost has the highest mean Macro-F1, while the paired comparisons quantify which metric-specific differences remain after Holm adjustment.
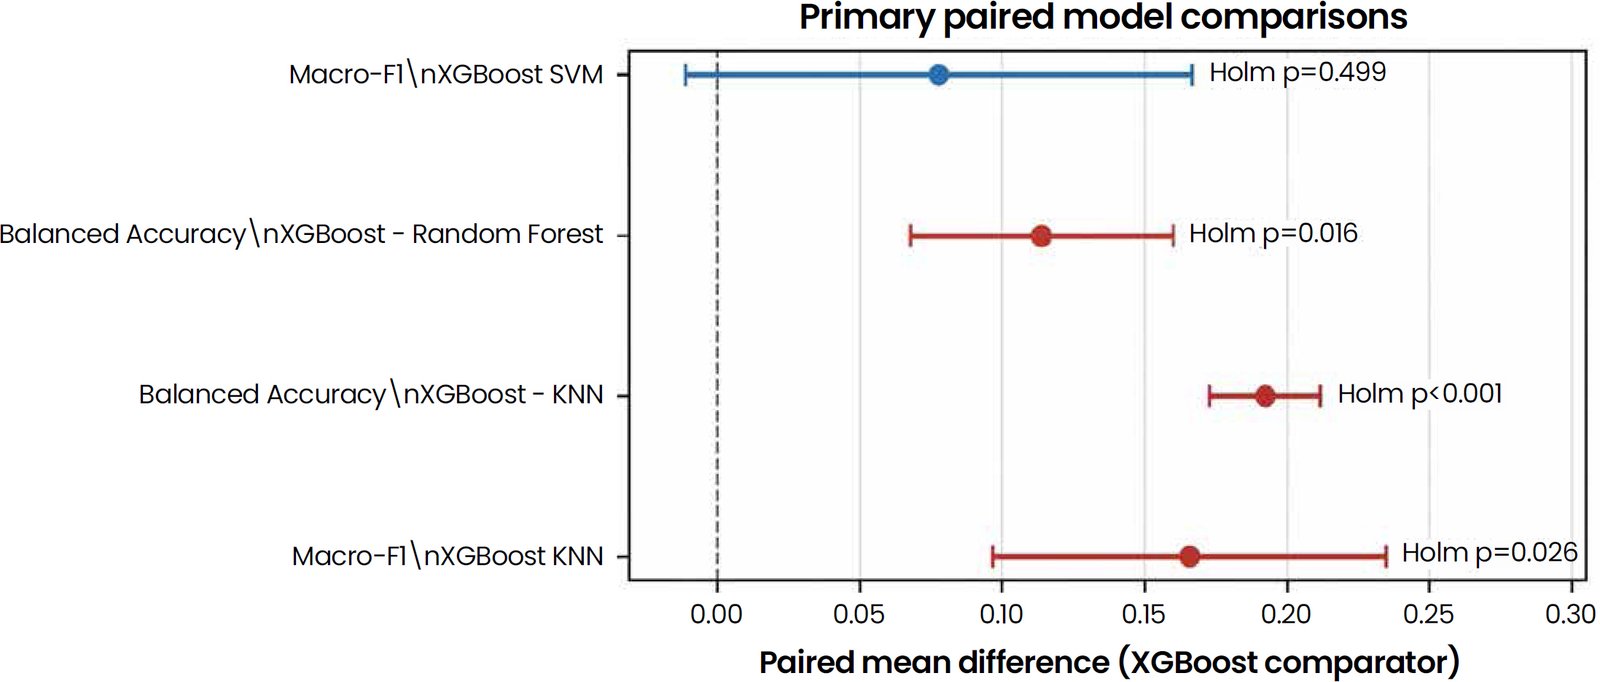
Fig. (3). Primary paired model comparisons; points show paired mean differences, bars show 95% confidence intervals, and labels show Holm-adjusted p-values.
4.3. Statistical Comparison of Participant-Grouped Models
Table 4 presents the paired XGBoost-oriented comparisons across five participant-held-out folds.
Table 4. Paired XGBoost-oriented comparisons across five participant-held-out folds.
| Comparison | Δ mean / median | Shapiro p; t(4) | p; Holm p | 95% CI; Cohen dz |
| Accuracy vs KNN | 0.0185 / 0.0136 | 0.7845; 2.212 | 0.0914; 0.5466 | [-0.0047, 0.0418]; 0.989 |
| Accuracy vs Logistic Regression | 0.0851 / 0.0717 | 0.8762; 2.355 | 0.0781; 0.5466 | [-0.0152, 0.1855]; 1.053 |
| Accuracy vs Random Forest | 0.0054 / 0.0068 | 0.6635; 0.760 | 0.4895; 0.6795 | [-0.0144, 0.0252]; 0.340 |
| Accuracy vs SVM | 0.0526 / 0.0664 | 0.6702; 3.345 | 0.0287; 0.2870 | [0.0089, 0.0962]; 1.496 |
| Macro-F1 vs KNN | 0.1657 / 0.1599 | 0.2834; 6.655 | 0.0026; 0.0265 | [0.0966, 0.2348]; 2.976 |
| Macro-F1 vs Logistic Regression | 0.0950 / 0.1061 | 0.5703; 1.835 | 0.1403; 0.7270 | [-0.0487, 0.2388]; 0.821 |
| Macro-F1 vs Random Forest | 0.0790 / 0.0873 | 0.8389; 3.063 | 0.0376; 0.3004 | [0.0074, 0.1507]; 1.370 |
| Macro-F1 vs SVM | 0.0780 / 0.0953 | 0.8988; 2.439 | 0.0713; 0.4991 | [-0.0108, 0.1667]; 1.091 |
| Balanced Accuracy vs KNN | 0.1922 / 0.1957 | 0.5376; 27.551 | <0.001; <0.001 | [0.1729, 0.2116]; 12.321 |
| Balanced Accuracy vs Logistic Regression | -0.0225 / -0.0150 | 0.6686; -0.639 | 0.5573; 1.0000 | [-0.1204, 0.0753]; -0.286 |
| Balanced Accuracy vs Random Forest | 0.1138 / 0.1150 | 0.5231; 6.866 | 0.0024; 0.0165 | [0.0678, 0.1598]; 3.071 |
| Balanced Accuracy vs SVM | 0.0049 / 0.0009 | 0.9356; 0.258 | 0.8094; 1.0000 | [-0.0482, 0.0580]; 0.115 |
| ROC-AUC vs KNN | 0.0946 / 0.0964 | 0.9625; 4.389 | 0.0118; 0.0943 | [0.0347, 0.1544]; 1.963 |
| ROC-AUC vs Logistic Regression | 0.0234 / 0.0366 | 0.1485; 1.992 | 0.1172; 0.5862 | [-0.0092, 0.0560]; 0.891 |
| ROC-AUC vs Random Forest | 0.0093 / 0.0085 | 0.9695; 0.715 | 0.5144; 0.5862 | [-0.0267, 0.0452]; 0.320 |
| ROC-AUC vs SVM | 0.0336 / 0.0300 | 0.5744; 2.482 | 0.0680; 0.4082 | [-0.0040, 0.0711]; 1.110 |
| PR-AUC vs KNN | 0.0216 / 0.0203 | 0.7309; 3.320 | 0.0294; 0.2643 | [0.0035, 0.0396]; 1.485 |
| PR-AUC vs Logistic Regression | 0.0046 / 0.0049 | 0.3426; 1.196 | 0.2977; 1.0000 | [-0.0061, 0.0152]; 0.535 |
| PR-AUC vs Random Forest | 0.0025 / 0.0027 | 0.9940; 1.328 | 0.2547; 1.0000 | [-0.0028, 0.0079]; 0.594 |
| PR-AUC vs SVM | 0.0045 / 0.0064 | 0.8194; 1.738 | 0.1572; 0.9431 | [-0.0027, 0.0118]; 0.777 |
The AUC comparison uses predicted probabilities from the grouped-CV analysis rather than hard class labels, providing leakage-safe ROC-AUC and PR-AUC estimates (Fig. 4).
In the grouped-CV analysis, XGBoost achieved ROC-AUC 0.9203 ± 0.0430 and PR-AUC 0.9890 ± 0.0091. These probability-based values provide a more credible estimate of discrimination under participant grouping.
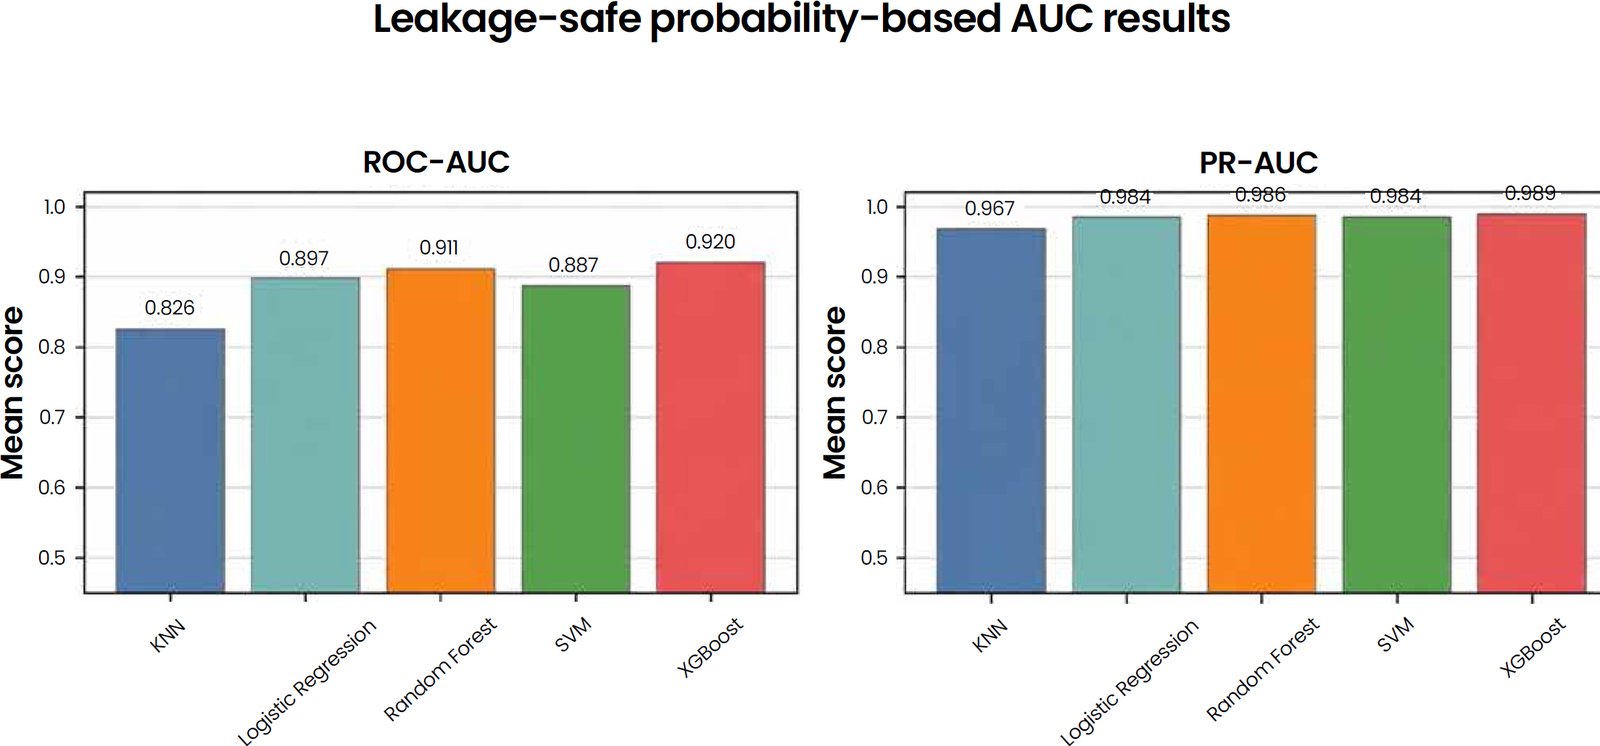
Fig. (4). Leakage-safe ROC-AUC and PR-AUC values calculated from predicted probabilities.
4.4. Threshold Sensitivity and Confidence Intervals
Threshold sensitivity showed that the 600-minute threshold achieved the highest Macro-F1 (0.8082 ± 0.0333) and balanced accuracy (0.7962 ± 0.0577). The 540-minute threshold had higher accuracy, ROC-AUC and PR-AUC, whereas the 660-minute threshold was lower across the reported metrics.
The threshold-sensitivity table assesses XGBoost with other choices for the sedentary-minute cut-off. It is a comparison between the selected 600-minute threshold and 540 and 660 minutes.
Table 5 presents the XGBoost threshold-sensitivity results across the evaluated sedentary-minute cut-offs.
Table 5. XGBoost threshold sensitivity results (mean ± SD).
| Threshold | Accuracy | Macro-F1 | Balanced accuracy | ROC-AUC | PR-AUC |
| 540 | 0.9490 ± 0.0214 | 0.7280 ± 0.1067 | 0.7344 ± 0.1558 | 0.9315 ± 0.0374 | 0.9937 ± 0.0051 |
| 600 | 0.9366 ± 0.0183 | 0.8082 ± 0.0333 | 0.7962 ± 0.0577 | 0.9203 ± 0.0430 | 0.9890 ± 0.0091 |
| 660 | 0.8839 ± 0.0186 | 0.7601 ± 0.0207 | 0.7557 ± 0.0387 | 0.8672 ± 0.0507 | 0.9689 ± 0.0201 |
The threshold table shows that 600 minutes is the most balanced cut-off because it maximises Macro-F1 and balanced accuracy, although 540 minutes gives higher accuracy and probability-based AUC values.
Threshold-sensitivity assesses the performance of XGBoost with different values of the sedentary cut-off. This chart compares the 540-, 600-, and 660-minute thresholds to determine whether the chosen 600-minute threshold is defensible.
The threshold in Fig. (5) confirms that the 600-minute cut-off provides the strongest balance between overall and imbalance-aware performance.
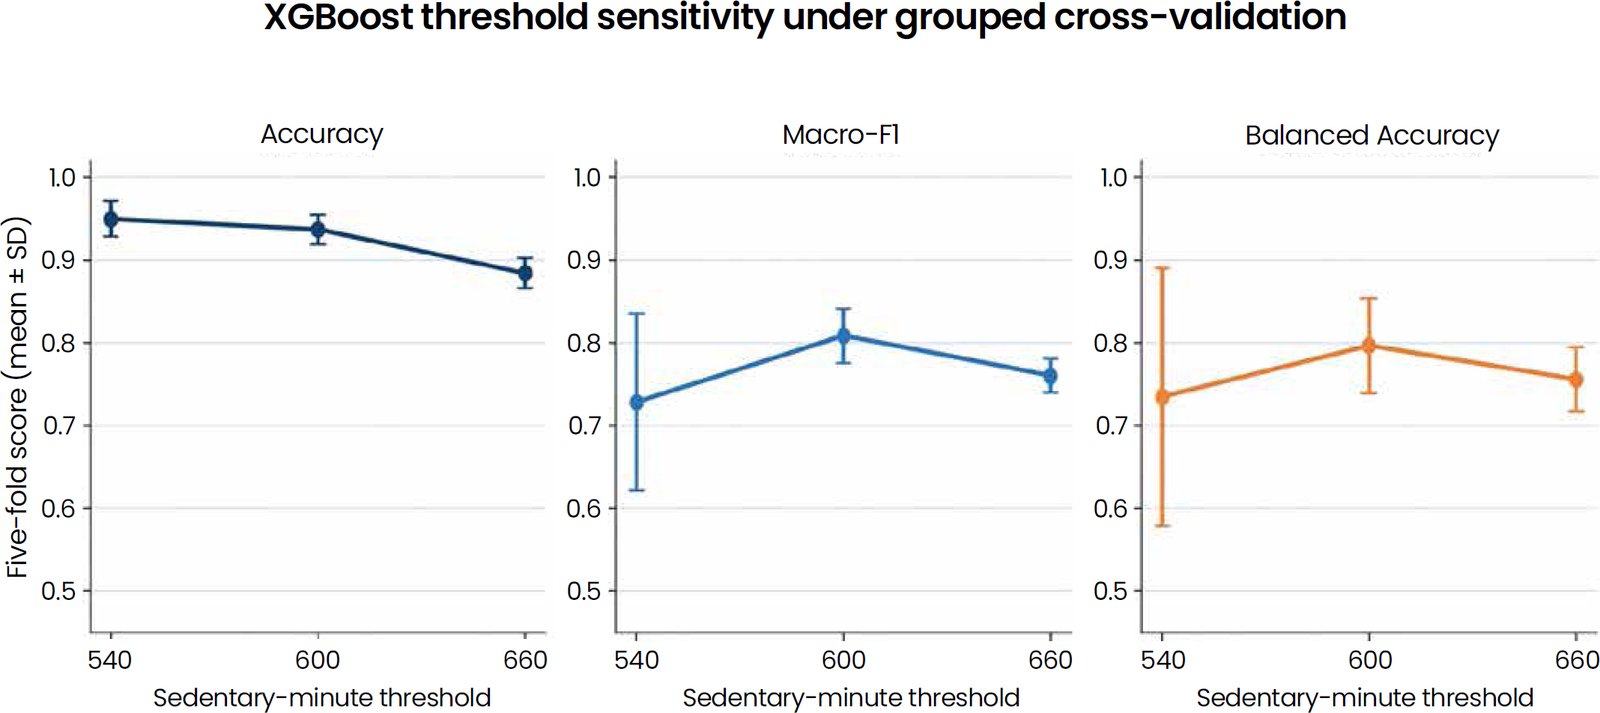
Fig. (5). XGBoost performance across the 540-, 600- and 660-minute thresholds.
The bootstrapped uncertainty estimates of the best binary classifier are provided in the confidence interval table. It gives the point estimate and 95% confidence intervals for all the key XGBoost metrics.
Table 6 presents the participant-level bootstrap 95% confidence intervals for XGBoost.
Table 6. Participant-level bootstrap 95% confidence intervals for XGBoost.
| Metric | Point estimate | 95% CI lower | 95% CI upper |
| Accuracy | 0.9363 | 0.9107 | 0.9587 |
| Macro-F1 | 0.8052 | 0.7778 | 0.8307 |
| Balanced accuracy | 0.7880 | 0.7429 | 0.8338 |
| ROC-AUC | 0.9127 | 0.8753 | 0.9512 |
| PR-AUC | 0.9875 | 0.9759 | 0.9957 |
The bootstrap intervals quantify uncertainty around the XGBoost estimates; the relatively narrow intervals for accuracy, Macro-F1, ROC-AUC and PR-AUC support stable probability-based evaluation, while balanced accuracy remains more variable.
The confidence-interval in Fig. (6) visualises statistical uncertainty around the best XGBoost model. It reports point estimates and bootstrapped 95% intervals for the main classification metrics.
The small confidence interval of PR-AUC and the small confidence interval of ROC-AUC indicate good discrimination power. The large confidence interval of balanced accuracy indicates problems related to class imbalance.
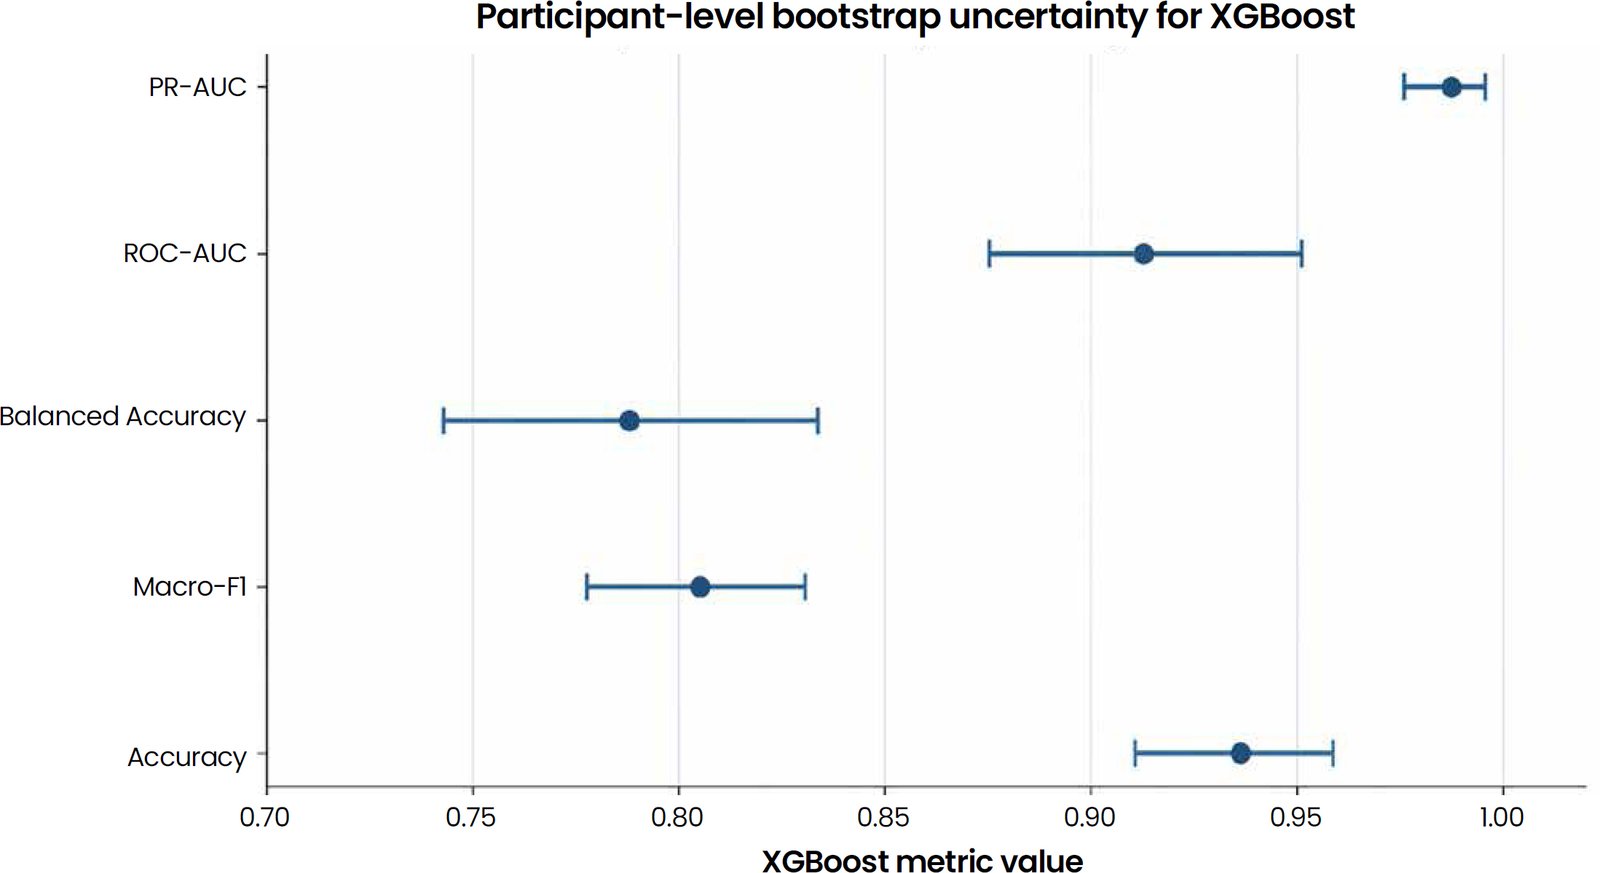
Fig. (6). Participant-level bootstrap point estimates and 95% confidence intervals for XGBoost.
4.5. Modality Ablation, Three-Level Classification and Regression
The modality-wise ablation study indicates that our full set of engineered multimodal features achieved the best performance. Features derived from activity only, sleep only, and heart rate only performed worse as compared to the features that utilised different modalities, indicating that better sedentary-behaviour predictions can be achieved through the use of multimodal information from different Fitbit-derived data. The distribution of the three-level sedentary-behaviour label, presented in the following table, shows the division of daily sedentary time into low, moderate and high, which enables the analysis beyond binary labels.
The ablation table compares activity-only, sleep-only, heart-rate-only, and multimodal feature sets. It shows how each modality contributes to the final XGBoost sedentary-behaviour classifier.
The full multimodal engineered feature set achieves the highest macro-F1, balanced accuracy, and ROC-AUC. This confirms that engineered multimodal fusion improves detection compared with isolated activity, sleep, or heart-rate features.
The ablation in Fig. (7) compares feature modalities using XGBoost macro-F1. It shows whether activity, sleep, heart rate, and engineered multimodal features contribute differently to sedentary-behaviour detection.
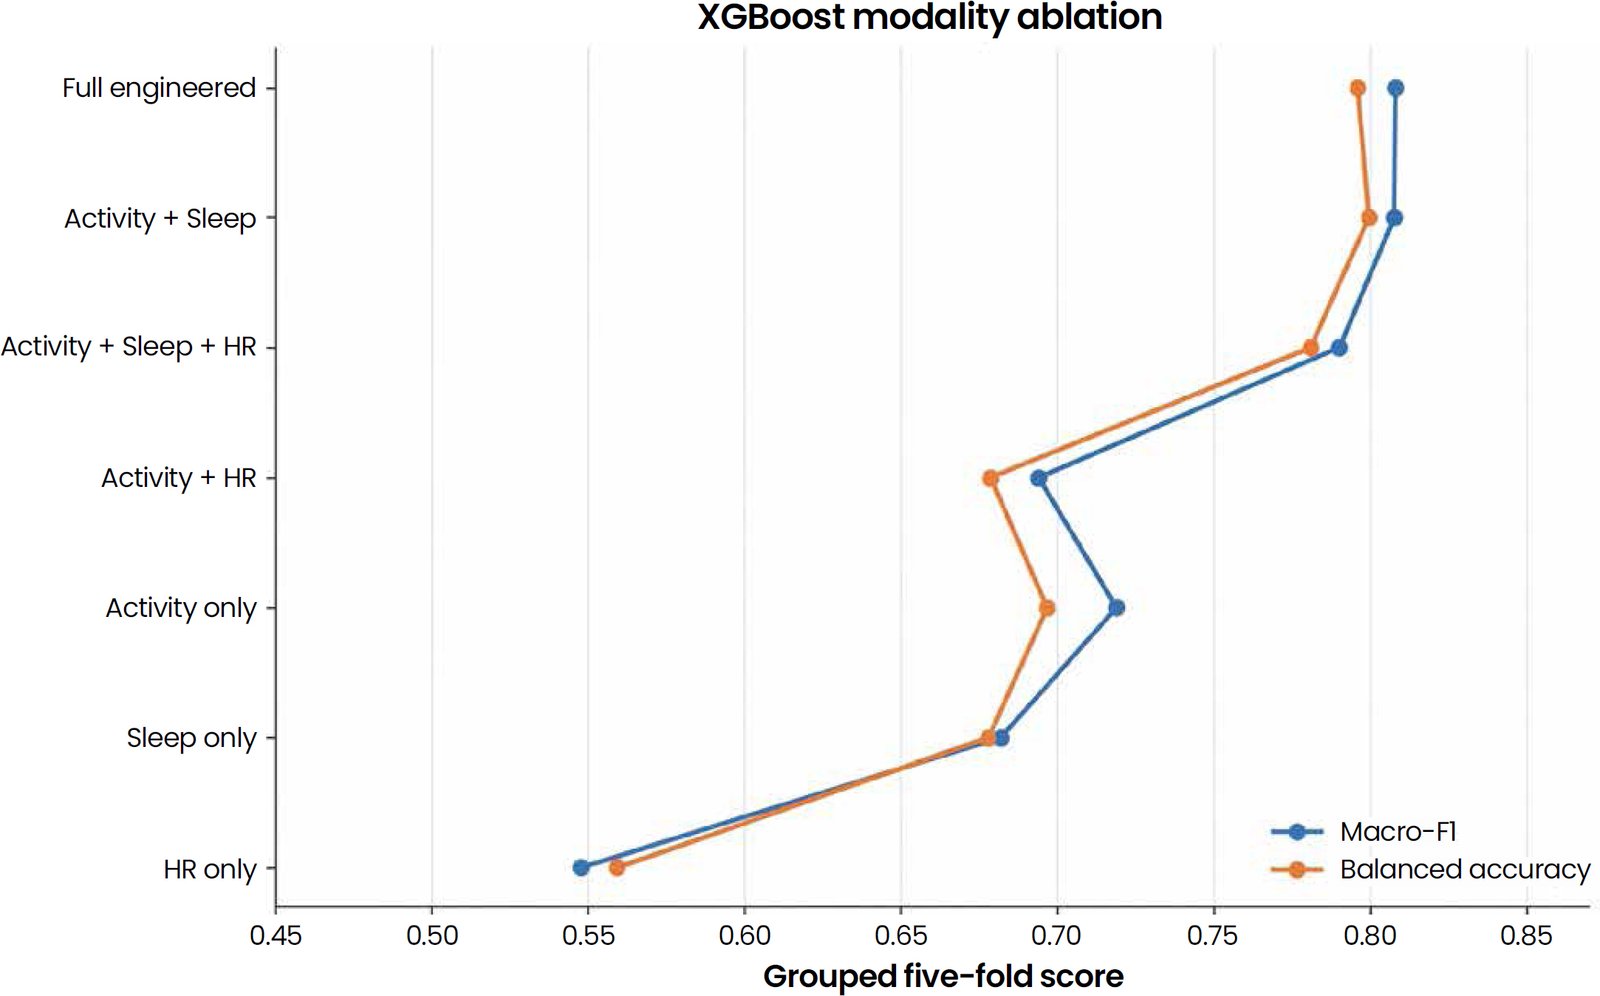
Fig. (7). Modality-wise ablation based on XGBoost macro-F1.
Table 7 presents the modality-wise ablation results using XGBoost.
Table 7. Modality-wise ablation results using XGBoost (mean ± SD).
| Feature set | Features | Accuracy | Macro-F1 | Balanced accuracy | ROC-AUC | PR-AUC |
| Activity only | 32 | 0.9184 ± 0.0132 | 0.7190 ± 0.0614 | 0.6968 ± 0.0723 | 0.7865 ± 0.0853 | 0.9654 ± 0.0178 |
| Sleep only | 5 | 0.8957 ± 0.0244 | 0.6819 ± 0.0598 | 0.6780 ± 0.0559 | 0.6771 ± 0.0927 | 0.9442 ± 0.0112 |
| Heart rate only | 4 | 0.8612 ± 0.0367 | 0.5478 ± 0.0435 | 0.5594 ± 0.0528 | 0.5296 ± 0.0775 | 0.9140 ± 0.0239 |
| Activity + Sleep | 37 | 0.9346 ± 0.0211 | 0.8078 ± 0.0313 | 0.7997 ± 0.0486 | 0.9074 ± 0.0495 | 0.9859 ± 0.0121 |
| Activity + Heart rate | 35 | 0.9062 ± 0.0199 | 0.6941 ± 0.0350 | 0.6787 ± 0.0522 | 0.7794 ± 0.0930 | 0.9643 ± 0.0164 |
| Activity + Sleep + Heart rate | 40 | 0.9300 ± 0.0192 | 0.7902 ± 0.0266 | 0.7810 ± 0.0548 | 0.9116 ± 0.0444 | 0.9871 ± 0.0098 |
| Full multimodal engineered | 42 | 0.9366 ± 0.0183 | 0.8082 ± 0.0333 | 0.7962 ± 0.0577 | 0.9203 ± 0.0430 | 0.9890 ± 0.0091 |
The ablation pattern shows that the full engineered multimodal feature set performs best. This supports the argument that sedentary behaviour is better captured using combined activity, sleep, heart-rate, and intensity features than by a single modality alone.
The following table reports the three-level sedentary-behaviour label distribution. It separates daily sedentary time into low, moderate, and high categories to support analysis beyond a binary label.
Table 8 presents the three-level sedentary-behaviour label distribution.
Table 8. Three-level sedentary behaviour label distribution.
| Class | Sedentary minutes | Count |
| Low | <300 | 24 |
| Moderate | 300-599 | 110 |
| High | >=600 | 1263 |
The number of instances in each class indicates significant imbalance in the data, where the high-sedentary class strongly dominates the dataset. This substantial imbalance warrants the utilisation of macro-F1, balanced accuracy and PR-AUC in the revised evaluation, which coincides with the literature on imbalanced learning, indicating that there is a difference between overall accuracy and evaluation that takes the presence of class imbalance into account. [65–67].
The grouped-CV table compares model performance for low, moderate and high sedentary categories using accuracy, Macro-F1, balanced accuracy and one-vs-rest ROC-AUC.
Table 9 presents the participant-grouped five-fold three-level classification results.
Table 9. Participant-grouped five-fold three-level classification results (mean ± SD).
| Model | Accuracy | Macro-F1 | Balanced accuracy | ROC-AUC OvR |
| KNN | 0.9094 ± 0.0207 | 0.4322 ± 0.0667 | 0.4061 ± 0.0456 | 0.8226 ± 0.0830 |
| Logistic Regression | 0.8367 ± 0.0290 | 0.5864 ± 0.0366 | 0.7177 ± 0.0613 | 0.8768 ± 0.0686 |
| Random Forest | 0.9177 ± 0.0218 | 0.5246 ± 0.1172 | 0.4827 ± 0.0848 | 0.9209 ± 0.0406 |
| SVM | 0.8682 ± 0.0454 | 0.6155 ± 0.0432 | 0.6849 ± 0.1128 | 0.9105 ± 0.0417 |
| XGBoost | 0.9167 ± 0.0116 | 0.6598 ± 0.0698 | 0.6653 ± 0.1189 | 0.9314 ± 0.0291 |
In the three-level grouped-CV task, XGBoost achieved the highest accuracy (0.9167 ± 0.0116), Macro-F1 (0.6598 ± 0.0698) and ROC-AUC OvR (0.9314 ± 0.0291), while Logistic Regression achieved the highest balanced accuracy (0.7177 ± 0.0613). Low and moderate classes remained challenging because of their limited representation.
The three-level classification in Fig. (8) displays the grouped-CV model performance; the underlying class counts remain reported separately in Table 9.
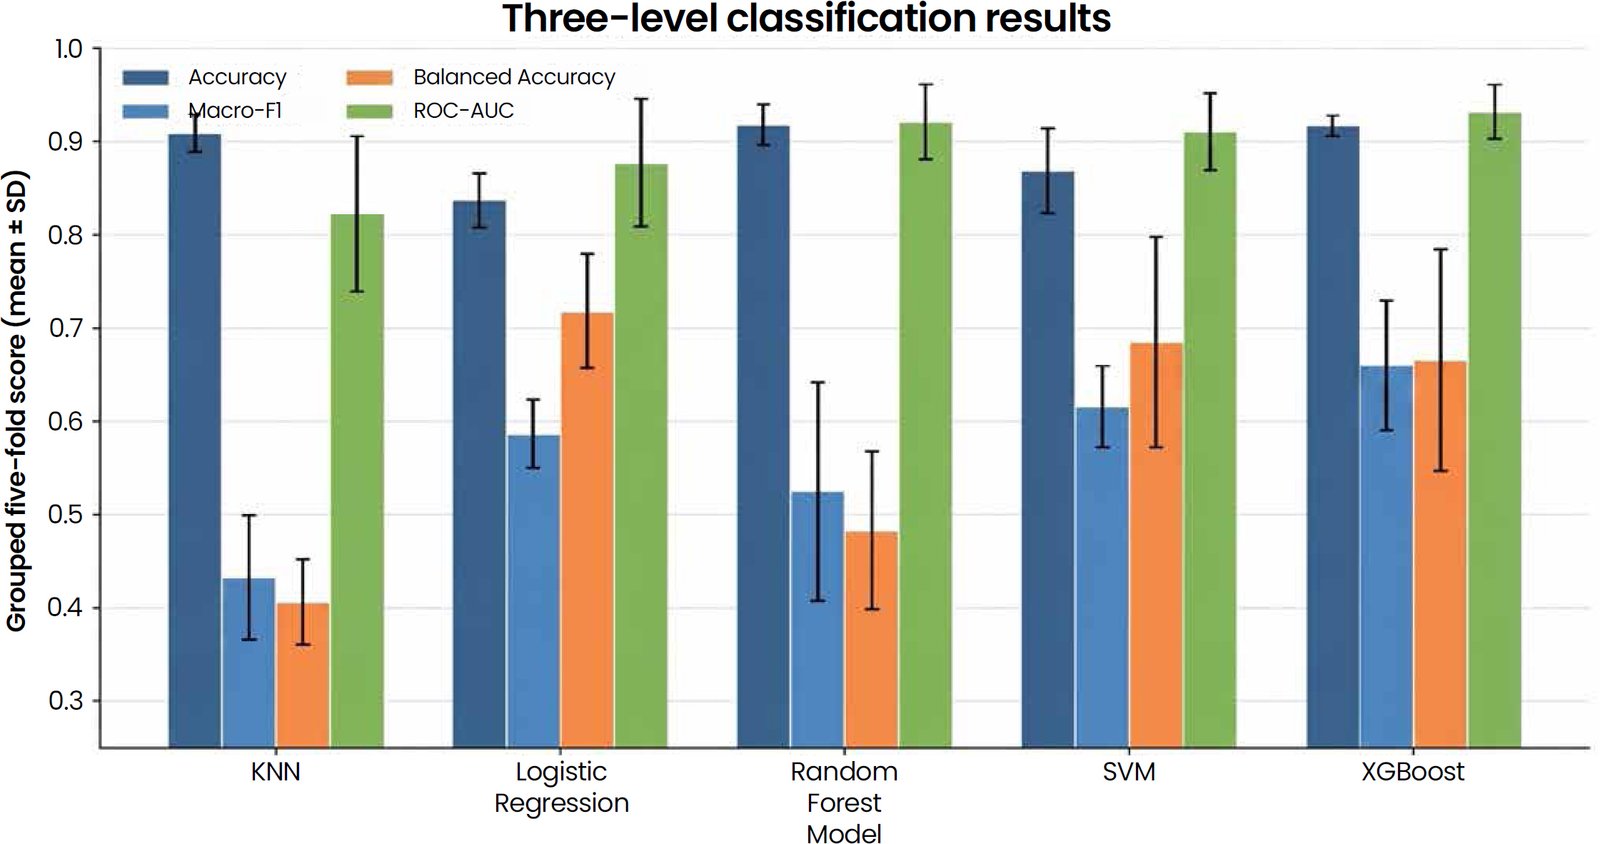
Fig. (8). Participant-grouped five-fold three-level classification performance.
The class-count table shows that the high-sedentary category dominates the data, while the low and moderate categories are comparatively small. This imbalance justifies the use of Macro-F1 and balanced accuracy in addition to overall accuracy.
The regression table evaluates models that predict sedentary minutes as a continuous outcome. It uses MAE, RMSE, and R-squared to quantify error magnitude and explained variance.
Table 10 presents the single-split sedentary-minutes regression results.
Table 10. Single-split sedentary-minutes regression results.
| Model | MAE | RMSE | R² |
| Linear Regression | 121.8233 | 179.6149 | 0.7037 |
| SVR | 311.7837 | 352.9145 | -0.1440 |
| Random Forest Regressor | 98.0752 | 157.1491 | 0.7732 |
| XGBoost Regressor | 93.4182 | 142.6793 | 0.8130 |
The single-split regression estimates are reported separately; the participant-grouped regression estimates are reported in Table 11.
Table 11. Participant-grouped five-fold regression results (mean ± SD).
| Model | MAE | RMSE | R² |
| Linear Regression | 219.7040 ± 27.5423 | 256.2213 ± 31.7341 | 0.2654 ± 0.2140 |
| SVR | 219.2581 ± 24.2518 | 277.8500 ± 27.7679 | 0.1277 ± 0.3135 |
| Random Forest Regressor | 139.8190 ± 14.5425 | 187.8491 ± 14.2773 | 0.6104 ± 0.0750 |
| XGBoost Regressor | 135.6867 ± 11.9773 | 181.5202 ± 17.0739 | 0.6310 ± 0.1047 |
The grouped regression cross-validation table reports participant-level validation for the sedentary-minutes prediction task. Mean and standard deviation values are included to evaluate the stability of regression performance across grouped folds.
Table 11 presents the participant-grouped five-fold regression results.
Grouped-CV regression favoured XGBoost Regressor, which achieved the lowest mean CV MAE (135.6867 ± 11.9773 minutes), the lowest RMSE (181.5202 ± 17.0739 minutes) and the highest R² (0.6310 ± 0.1047). Random Forest Regressor was close behind, whereas SVR showed the weakest grouped-CV R².
The regression performance in Fig. (9) compares participant-grouped five-fold MAE, RMSE and R² across the four regression models.
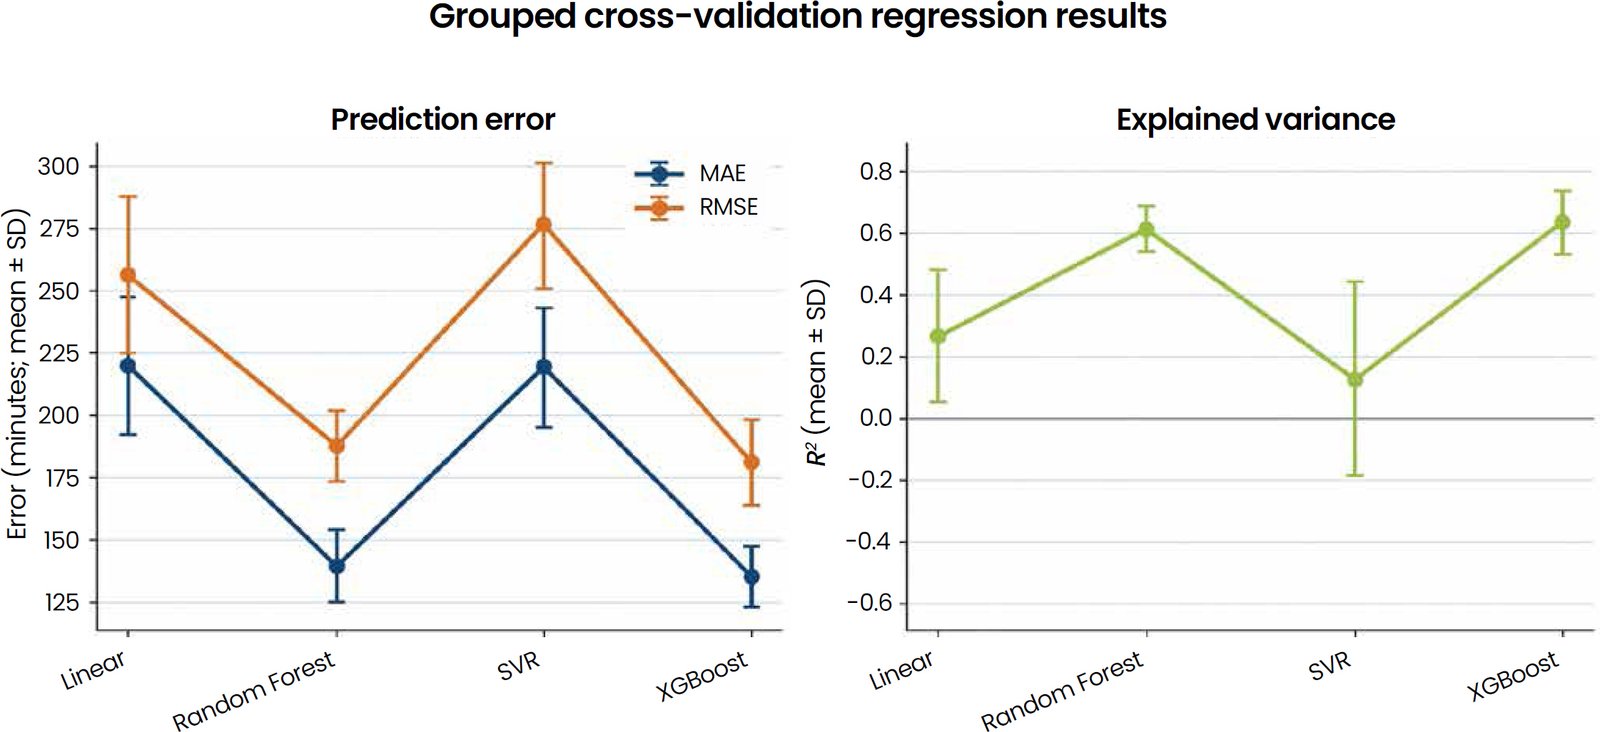
Fig. (9). Participant-grouped five-fold regression performance.
The regression results indicate that the XGBoost Regressor explains the largest proportion of variance in sedentary minutes. This demonstrates that the framework can support continuous sedentary-time estimation in addition to classification.
The deep-learning extension table summarises the additional 1D-CNN and CNN-LSTM experiments. It reports sequence length, accuracy, macro-F1, and balanced accuracy for seven-day participant-level windows.
Table 12 presents the additional 1D-CNN and CNN-LSTM results.
Table 12. Additional 1D-CNN and CNN-LSTM results.
| Model | Sequence length | Accuracy | Macro-F1 | Bal. Acc. |
| 1D-CNN | 7 | 0.8462 | 0.6589 | 0.6423 |
| CNN-LSTM | 7 | 0.8623 | 0.6465 | 0.6185 |
CNN-LSTM provides slightly higher accuracy, while 1D-CNN provides slightly higher macro-F1 and balanced accuracy. Neither sequence model outperforms XGBoost, which supports the conclusion that stronger temporal data would be needed for DL gains.
The sequence-model comparison in Fig. (10) reports the performance of the additional 1D-CNN and CNN-LSTM models. It is included to strengthen the DL comparison and to assess whether sequence learning improves performance on seven-day windows.
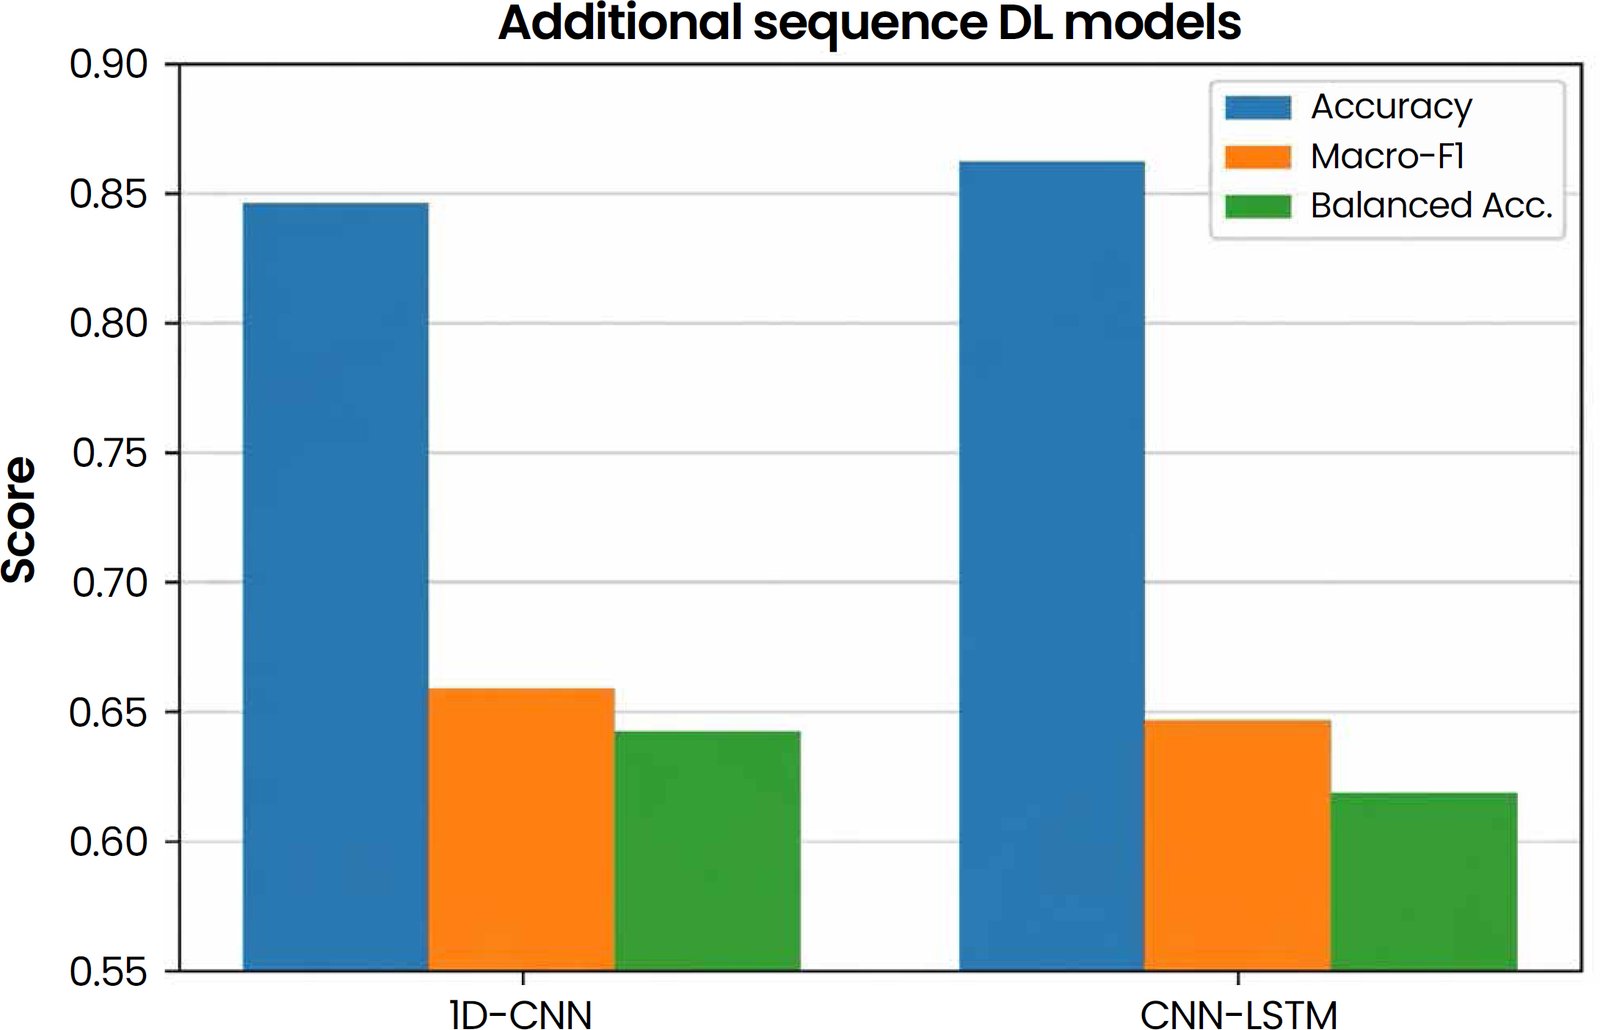
Fig. (10). Additional sequence DL model comparison.
The model CNN-LSTM achieved marginally higher accuracy than the 1D CNN. On the contrary, 1D CNN achieved higher values of macro-F1 and balanced accuracy compared to CNN-LSTM. Overall, in all cases, both models performed worse than the XGBoost model, indicating that tree-based tabular learning methods are favoured when a daily dataset derived from Fitbit data is utilised.
Fig. (11), representing the prototype interface, highlights how our modelling workflow can be transformed into a user-facing Streamlit application.
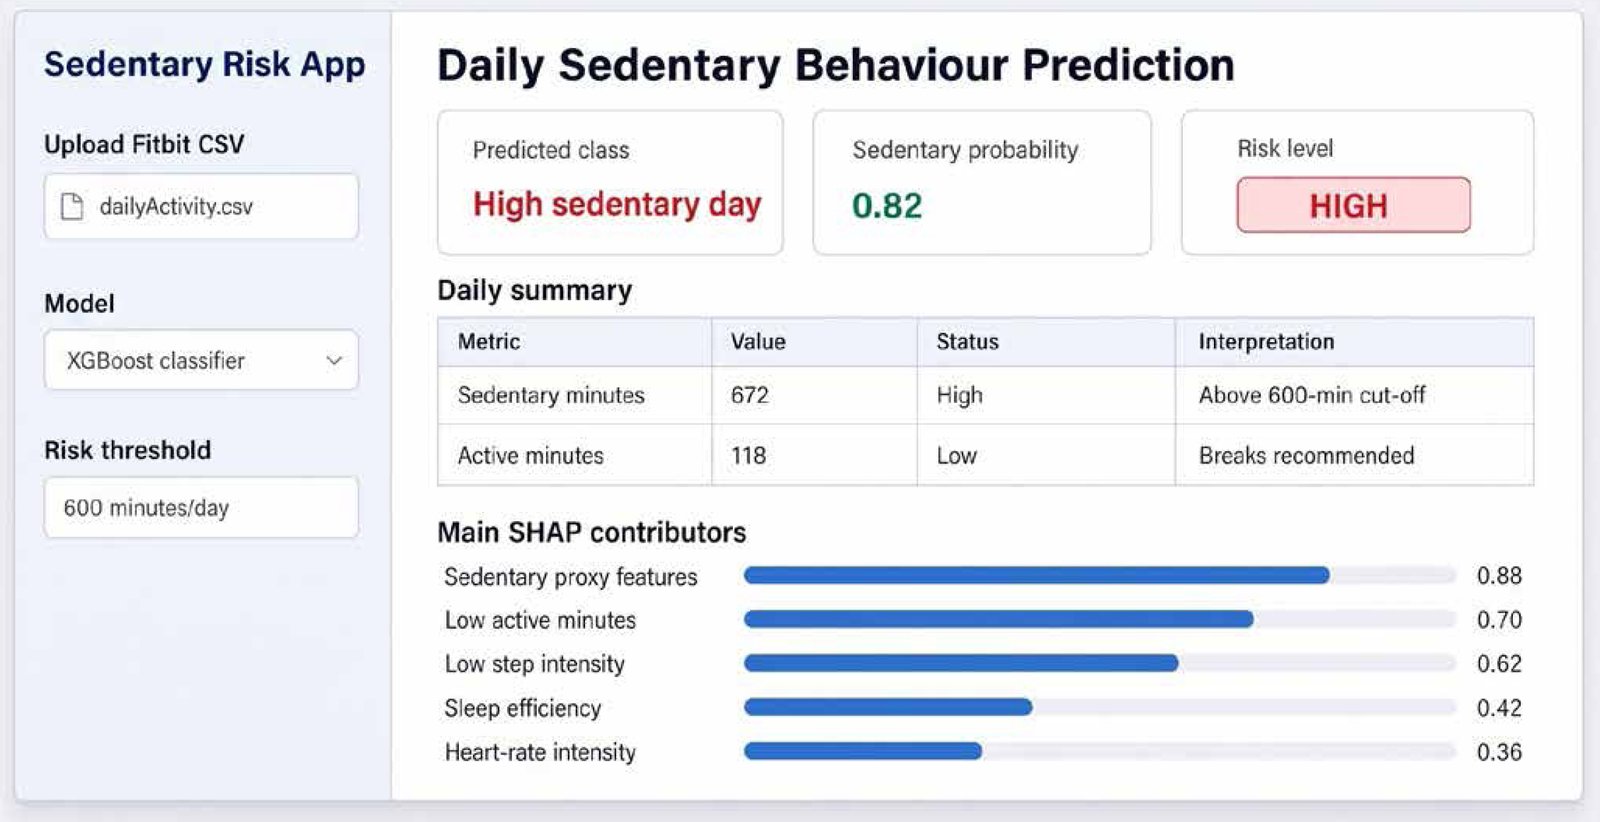
Fig. (11). Streamlit risk-scoring prototype for Fitbit-based sedentary behaviour prediction.
The interface presents a prototype approach to convert probabilities produced by the models to risk levels interpretable to users. This validation has not been tested for implementation in the workplace and should therefore not be construed as evidence for its effectiveness in practical applications.
Analytical Discussion
The model chosen is XGBoost, as this model continues to be the most efficient, as boosting trees is capable of addressing non-linear relationships, varying scales of input features and applied engineering through the table features. The entire set of engineered modalities in the table produced the highest macro-F1 score and AUC, as it is believed that sedentary behaviour is better characterised by combinations of activity, sleep, heart rate, and intensity variables rather than step counts alone.
The ROC-AUC method has been corrected to utilise predicted probabilities and leakage-free input to provide credible estimates on discrimination relative to the previous near-perfect value.
The three-level classification task showed that XGBoost achieved the highest accuracy, Macro-F1 and ROC-AUC OvR, while Logistic Regression achieved the highest balanced accuracy. Low and moderate classes remained challenging because of the high skewness of the dataset; regression additionally supported continuous sedentary-minute estimation.
The additional 1D-CNN and CNN-LSTM models improved the depth of the DL comparison, but they did not outperform XGBoost. This suggests that small, imbalanced, and daily aggregated Fitbit datasets favour robust tree-based ML models over sequence models that require larger and richer temporal inputs.
Comparative Analysis with Previous Studies
The revised results are competitive with previous sedentary-behaviour studies while avoiding a direct superiority claim because earlier studies used different devices, datasets, label definitions, and evaluation protocols. This caution is also warranted because broader wearable-activity studies use different device combinations, temporal inputs and transfer-learning strategies [68-70].
The comparative table places the revised study beside selected prior sedentary-behaviour detection studies. It is included to contextualise the revised results without making a direct superiority claim across different datasets and protocols.
Table 13 presents selected prior studies alongside the present study.
Table 13. Selected prior studies and the present study.
Study | Data/Method | Metric | Note |
Kańtoch (2018) [16] | Smart shirt sensors | Accuracy ≈95% ± 2.1% | ADL protocol |
Koster et al. (2016) [47] | ActiGraph vs activPAL | AUC ≈0.85-0.89 | Cut-point validation |
Rowlands et al. (2018) [48] | Wrist sedentary method | Agreement ≈85% ± 7% | Free-living + lab |
Kerr et al. (2018) [49] | Hip accelerometer + ML | Sitting ≈67% accuracy | Transitions difficult |
Papathomas et al. (2021) [19] | Fitbit daily steps | Accuracy ≈82.1% | Unseen users ≈77% |
This work (grouped CV) | Fitbit multimodal features | Accuracy 0.9366; Macro-F1 0.8082; ROC-AUC 0.9203; PR-AUC 0.9890 | Participant-grouped CV, bootstrap uncertainty, ablation, multiclass and regression |
The comparison shows that performance differs based on sensor protocol, labels, datasets, and validation design. Because the revised framework has been deemed an integrated Fitbit-based evaluation prototype, it is not meant to be used in place of previous methods already established. The explainability component remains consistent with larger work in healthcare regarding explainable deep learning [71], while Streamlit is retained only as the prototype interface framework [72].
Lessons Learned
Participant-independent evaluation was important because record-level random splitting can place data from the same participant in both training and testing sets. Excluding identifier and target-derived variables and using grouped validation produced lower but more credible estimates for unseen participants. This reinforces the need to report leakage controls alongside performance metrics.
CONCLUSION
This study proposed a revised and strengthened Sedentary Behaviour detection framework based on multimodal Fitbit data. The revised framework strengthens the evaluation by providing subject-independent validation, leakage-safe evaluation, probability-based validation (ROC-AUC, PR-AUC), grouped cross-validation, threshold sensitivity analysis, bootstrapped confidence intervals, modality-wise ablation, three-level classification, sedentary-time regression, and additional 1D-CNN/CNN-LSTM sequence models.
In the participant-grouped binary analysis, XGBoost achieved accuracy 0.9366 ± 0.0183, Macro-F1 0.8082 ± 0.0333, balanced accuracy 0.7962 ± 0.0577, ROC-AUC 0.9203 ± 0.0430 and PR-AUC 0.9890 ± 0.0091. These grouped-CV estimates are used as the primary results for unseen-participant evaluation, while the earlier single-split estimates remain separately identified.
The results from the ablation analysis showed that the full engineered multimodal feature set had the highest scores, which highlights the importance of integrating activity, sleep, heart rate, and intensity-related features. The analysis was expanded to include a three-level classification as well as regression. The exploratory CNN and CNN-LSTM models continued to improve on the comparison of models, while tree-based models were still best suited for this small and imbalanced Fitbit daily-derived dataset of movement. More recent wearable machine learning/deep learning work has also shown that model suitability depends on sensor modality, label design, and temporal richness [73, 74].
On the whole, the research provides an integrated, leakage-free, interpretable Fitbit-derived prototype for sedentary behaviour analysis. However, its usefulness for routine office use must be validated externally first.
LIMITATIONS AND FUTURE WORK
Some of the limitations include, firstly, a narrow, short-lived public dataset. Secondly, the labelling is based on the sedentary minutes from the Fitbit application rather than the actual validity of the postures. Thirdly, the model’s low and moderate categories are less represented. Fourthly, average hourly statistics are used, which may disrupt the application of sequential ML instead of tabular ML applications. Consequently, generalisation needs to be based on validations on larger and more diverse cohorts of office workers across different Users.
The future needs to focus on privacy-preserving and consent-based data collection and validation of the results externally by using other offices. Iterative retraining and drift monitoring should be the focus areas of future academic work before generalisation. The Streamlit program should remain as a prototype while implementing security in multi-user scenarios, implementing possibilities of direct integration to Fitbit, and using adaptive thresholds among other strategies.
LIST OF ABBREVIATIONS
CNNs | = | Convolutional Neural Networks |
DL | = | Deep Learning |
FNN | = | Feedforward Neural Network |
KNN | = | K-Nearest Neighbour |
LSTMs | = | Long Short-Term Memory |
ML | = | Machine Learning |
PR-AUC | = | Precision-Recall – Area Under the Curve |
ROC-AUC | = | Receiver Operating Characteristic – Area Under the Curve |
SB | = | Sedentary Behaviour |
SHAP | = | Shapley Additive explanations |
SVMs | = | Support Vector Machines |
SVR | = | Support Vector Regression |
AUTHORS’ CONTRIBUTIONS
D.R. and M.G.C. jointly contributed to the study concept or design. D.R. contributed to data collection, data analysis and interpretation, writing the paper, model implementation, experimental evaluation, visualization, and manuscript drafting, while M.G.C. contributed to data analysis and interpretation, methodology guidance and critical revision of the manuscript.
ETHICAL APPROVAL & INFORMED CONSENT
Formal ethical approval was not required because this study used a publicly available, de-identified secondary dataset and involved no direct recruitment or collection of identifiable participant data. Informed consent was not applicable because the analysis used a publicly available, de-identified dataset and no participants were directly contacted or enrolled by the authors.
AVAILABILITY OF DATA AND MATERIALS
The publicly available FitBit Fitness Tracker Data dataset used in this study is available through Kaggle at https://www.kaggle.com/datasets/arashnic/fitbit. The source files used in the analysis are identified in Section III-A, and no new personal data were collected by the authors.
FUNDING
This research received no financial support from any public, commercial, or not-for-profit funding agency.
CONFLICT OF INTEREST
The authors declare that they have no competing interests or conflicts of interest relevant to the content of this work.
ACKNOWLEDGEMENTS
None.
DECLARATION OF AI
No generative AI tools were used to generate, analyse, alter, or interpret the study data, statistical results, or scientific conclusions.
REFERENCES
[1] M. S. Tremblay et al., “Sedentary Behaviour Research Network (SBRN) – Terminology Consensus Project process and outcome,” Int J Behav Nutr Phys Act., vol. 14, no. 75, 2017.
https://doi.org/10.1186/s12966-017-0525-8
[2] N. Owen, G. N. Healy, C. E. Matthews, and D. W. Dunstan, “Too much sitting: The population-health science of sedentary behaviour,” Exerc. Sport Sci. Rev., vol. 38, no. 3, pp. 105–113, 2010. https://doi.org/10.1097/JES.0b013e3181e373a2
[3] M. Castillo-Retamal and E. A. Hinckson, “Measuring physical activity and sedentary behaviour at work: A review,” Work, vol. 40, no. 4, pp. 345–357, 2011.
https://doi.org/10.3233/WOR-2011-1246
[4] B. Cagnie, V. Danneels, D. Van Tiggelen, V. De Loose, and D. Cambier, “Individual and work-related risk factors for neck pain among office workers: A cross-sectional study,” Eur. Spine J., vol. 16, pp. 679–686, 2007.
https://doi.org/10.1007/s00586-006-0269-7
[5] D. P. Bailey and C. D. Locke, “Breaking up prolonged sitting with light-intensity walking improves postprandial glycemia, but breaking up sitting with standing does not,” J. Sci. Med. Sport, vol. 18, no. 3, pp. 294–298, 2015.
https://doi.org/10.1016/j.jsams.2014.03.008
[6] S. Parry and L. Straker, “The contribution of office work to sedentary behaviour associated risk,” BMC Public Health, vol. 13, Art. no. 296, 2013.
https://doi.org/10.1186/1471-2458-13-296
[7] U. Ekelund et al., “Does physical activity attenuate, or even eliminate, the detrimental association of sitting time with mortality? A harmonised meta-analysis of data from more than 1 million men and women,” The Lancet, vol. 388, no. 10051, pp. 1302–1310, 2016. https://doi.org/10.1016/S0140-6736(16)30370-1
[8] R. Patterson et al., “Sedentary behaviour and risk of all-cause, cardiovascular and cancer mortality, and incident type 2 diabetes: A systematic review and dose-response meta-analysis,” Eur. J. Epidemiol., vol. 33, pp. 811–829, 2018.
https://doi.org/10.1007/s10654-018-0380-1
[9] A. Biswas et al., “Sedentary time and its association with risk for disease incidence, mortality, and hospitalisation in adults: A systematic review and meta-analysis,” Ann. Intern. Med., vol. 162, no. 2, pp. 123–132, 2015.
https://doi.org/10.7326/M14-1651
[10] A. A. Thorp et al., “Sedentary behaviours and subsequent health outcomes in adults: A systematic review of longitudinal studies, 1996–2011,” Am. J. Prev. Med., vol. 41, no. 2, pp. 207–215, 2011. https://doi.org/10.1016/j.amepre.2011.05.004
[11] N. Shrestha et al., “Workplace interventions for reducing sitting at work,” Cochrane Database Syst. Rev., no. 6, Art. no. CD010912, 2018. https://doi.org/10.1002/14651858.CD010912.pub5
[12] N. Bongers et al., “Device-based measurement of office-based physical activity and sedentary time: A systematic review,” J. Meas. Phys. Behav., vol. 7, no. 1, 2024.
https://doi.org/10.1123/jmpb.2024-0011
[13] T. J. Saunders et al., “Sedentary behaviour and health in adults: an overview of systematic reviews,” Appl. Physiol. Nutr. Metab., vol. 45, no. 10 (Suppl. 2), pp. S197–S217, 2020.
https://doi.org/10.1139/apnm-2020-0272
[14] S. T. Boerema, L. van Velsen, H. J. Hermens, and M. M. R. Vollenbroek-Hutten, “Pattern measures of sedentary behaviour in adults: A literature review,” Digit. Health., vol. 6, pp. 1–17, 2020. https://doi.org/10.1177/2055207620905418
[15] Y. Wang et al., “Sedentary behaviour estimation with hip-worn accelerometer data: Segmentation, classification, and thresholding,” arXiv preprint arXiv:2207.01809, 2022. https://arxiv.org/abs/2207.01809
[16] S. Kańtoch, “Recognition of sedentary behaviour by machine-learning analysis of wearable sensors during activities of daily living or Telemedical Assessment of Cardiovascular Risk,” Sensors, vol. 18, no. 10, Art. no. 3219, 2018.
https://doi.org/10.3390/s18103219
[17] K. R. Evenson, M. M. Goto, and R. D. Furberg, “Systematic review of the validity and reliability of consumer-wearable activity trackers,” Int. J. Behav. Nutr. Phys. Act., vol. 12, Art. no. 159, 2015. https://doi.org/10.1186/s12966-015-0314-1
[18] L. M. Feehan et al., “Accuracy of Fitbit devices: Systematic review and narrative syntheses of quantitative data,” JMIR Mhealth Uhealth, vol. 6, no. 8, Art. no. e10527, 2018. Available: https://doi.org/10.2196/10527
[19] E. Papathomas, A. Triantafyllidis, R.-E. Mastoras, D. Giakoumis, K. Votis, and D. Tzovaras, “A machine learning approach for prediction of sedentary behaviour based on daily step counts,” in Proc. 43rd Annu. Int. Conf. IEEE Eng. Med. Biol. Soc. (EMBC), 2021, pp. 390–394. https://doi.org/10.1109/EMBC46164.2021.9630894
[20] C. Carpenter, C. H. Yang, and D. West, “A comparison of sedentary behaviour as measured by the Fitbit and activPAL in college students,” Int. J. Environ. Res. Public Health, vol. 18, no. 8, Art. no. 3914, 2021.
https://doi.org/10.3390/ijerph18083914
[21] L. Lederer, A. Breton, H. Jeong, H. Master, A. R. Roghanizad, and J. Dunn, “The importance of data quality control in using Fitbit device data from the All of Us Research Program,” JMIR Mhealth Uhealth, vol. 11, Art. no. e45103, 2023.
https://doi.org/10.2196/45103
[22] J. Delobelle et al., “Fitbit’s accuracy to measure short bouts of stepping and sedentary behaviour: Validation, sensitivity and specificity study,” Digit. Health, vol. 10, 2024. https://doi.org/10.1177/20552076241262710
[23] N. Redenius, Y. Kim, and W. Byun, “Concurrent validity of the Fitbit for assessing sedentary behaviour and moderate-to-vigorous physical activity,” BMC Med. Res. Methodol., vol. 19, Art. no. 29, 2019. https://doi.org/10.1186/s12874-019-0668-1
[24] M. S. Patel et al., “Effect of a game-based intervention designed to enhance social incentives to increase physical activity among families: The BE FIT randomised clinical trial,” JAMA Intern. Med., vol. 177, no. 11, pp. 1586–1593, 2017. https://doi.org/10.1001/jamainternmed.2017.3458
[25] V. Farrahi and M. Rostami, “Machine learning in physical activity, sedentary, and sleep behaviour research,” J. Activity, Sedentary Sleep Behav., vol. 3, Art. no. 5, 2024.
https://doi.org/10.1186/s44167-024-00045-9
[26] C. E. Matthews et al., “Amount of time spent in sedentary behaviours in the United States, 2003–2004,” Am. J. Epidemiol., vol. 167, no. 7, pp. 875–881, 2008.
https://doi.org/10.1093/aje/kwm390
[27] K. Y. Chen and D. R. Bassett, “The technology of accelerometry-based activity monitors: Current and future,” Med. Sci. Sports Exerc., vol. 37, no. 11, pp. S490–S500, 2005. https://doi.org/10.1249/01.mss.0000185571.49104.82
[28] J. H. Migueles et al., “Accelerometer data collection and processing criteria to assess physical activity and other outcomes: A systematic review and practical considerations,” Sports Med., vol. 47, no. 9, pp. 1821–1845, 2017.
https://doi.org/10.1007/s40279-017-0716-0
[29] Y. Bai et al., “Comparison of consumer and research monitors under semistructured settings,” Med. Sci. Sports Exerc., vol. 48, no. 1, pp. 151–158, 2016.
https://doi.org/10.1249/MSS.0000000000000727
[30] S. Kwon, R. D. Burns, Y. Kim, Y. Bai, and W. Byun, “Inter-device agreement between Fitbit Flex 1 and 2 for assessing sedentary behaviour and physical activity,” Int. J. Environ. Res. Public Health, vol. 18, no. 5, Art. no. 2716, 2021.
https://doi.org/10.3390/ijerph18052716
[31] A. M. Ngueleu et al., “Criterion validity of ActiGraph monitoring devices for step counting and distance measurement in adults and older adults: a systematic review,” J. Neuroeng. Rehabil., vol. 19, Art. no. 112, 2022.
https://doi.org/10.1186/s12984-022-01085-5
[32] Y. Weizman et al., “The use of wearable devices to measure sedentary behaviour during COVID-19: A systematic review and future recommendations,” Sensors, vol. 23, no. 23, Art. no. 9449, 2023. https://doi.org/10.3390/s23239449
[33] T. Chen and C. Guestrin, “XGBoost: A scalable tree boosting system,” in Proc. 22nd ACM SIGKDD Int. Conf. Knowl. Discov. Data Min., 2016, pp. 785–794.
https://doi.org/10.1145/2939672.2939785
[34] L. Breiman, “Random forests,” Mach. Learn., vol. 45, no. 1, pp. 5–32, 2001.
https://doi.org/10.1023/A:1010933404324
[35] C. Cortes and V. Vapnik, “Support-vector networks,” Mach. Learn., vol. 20, pp. 273–297, 1995.
https://doi.org/10.1007/BF00994018
[36] F. Pedregosa et al., “Scikit-learn: Machine learning in Python,” J. Mach. Learn. Res., vol. 12, pp. 2825–2830, 2011. https://jmlr.org/papers/v12/pedregosa11a.html (Accessed on: 2026 Aug 9).
[37] S. M. Lundberg and S.-I. Lee, “A unified approach to interpreting model predictions,” in Proc. Adv. Neural Inf. Process. Syst. (NeurIPS), 2017. Available from: https://papers.nips.cc/paper_files/paper/2017/hash/8a20a8621978632d76c43dfd28b67767-Abstract.html (Accessed on: 2026 Aug 9).
[38] H. W. Loh et al., “Application of explainable artificial intelligence for healthcare: A systematic review of the last decade (2011-2022),” Comput. Methods Programs Biomed., vol. 226, Art. no. 107161, 2022. https://doi.org/10.1016/j.cmpb.2022.107161
[39] Z. Zhao et al., “Deep Residual Bidir-LSTM for Human Activity Recognition Using Wearable Sensors,” Math. Probl. Eng., vol. 2018, Art. no. 7316954, 2018.
https://doi.org/10.1155/2018/7316954
[40] N. Y. Hammerla, S. Halloran, and T. Plötz, “Deep, convolutional, and recurrent models for human activity recognition using wearables,” in Proc. 25th Int. Joint Conf. Artif. Intell. (IJCAI), 2016, pp. 1533–1540. https://www.ijcai.org/Proceedings/16/Papers/220.pdf (Accessed on: 2026 Aug 9).
[41] F. J. Ordóñez and D. Roggen, “Deep convolutional and LSTM recurrent neural networks for multimodal wearable activity recognition,” Sensors, vol. 16, no. 1, Art. no. 115, 2016. https://doi.org/10.3390/s16010115
[42] C. A. Ronao and S.-B. Cho, “Human activity recognition with smartphone sensors using deep learning neural networks,” Expert Syst. Appl., vol. 59, pp. 235–244, 2016. https://doi.org/10.1016/j.eswa.2016.04.032
[43] A. Ignatov, “Real-time human activity recognition from accelerometer data using convolutional neural networks,” Appl. Soft Comput., vol. 62, pp. 915–922, 2018.
https://doi.org/10.1016/j.asoc.2017.09.027
[44] S. Hochreiter and J. Schmidhuber, “Long short-term memory,” Neural Comput., vol. 9, no. 8, pp. 1735–1780, 1997. https://doi.org/10.1162/neco.1997.9.8.1735
[45] S. Zhang et al., “Deep learning in human activity recognition with wearable sensors: A review on advances,” Sensors, vol. 22, no. 4, Art. no. 1476, 2022.
https://doi.org/10.3390/s22041476
[46] G. Kalouris, E. I. Zacharaki, and V. Megalooikonomou, “Improving CNN-based activity recognition by data augmentation and transfer learning,” in Proc. 17th IEEE Int. Conf. Ind. Informat. (INDIN), pp. 1387–1394, 2019.
https://doi.org/10.1109/INDIN41052.2019.8972135
[47] A. Koster et al., “Comparison of sedentary estimates between activPAL and Hip- and wrist-worn ActiGraph,” Med. Sci. Sports Exerc., vol. 48, no. 8, pp. 1514–1522, 2016. https://doi.org/10.1249/MSS.0000000000000924
[48] A. V. Rowlands et al., “Beyond cut-points: Accelerometer metrics that capture the physical activity profile,” Med. Sci. Sports Exerc., vol. 50, no. 6, pp. 1323–1332, 2018. https://doi.org/10.1249/MSS.0000000000001561
[49] J. Kerr et al., “Improving hip-worn accelerometer estimates of sitting using machine learning methods,” Med. Sci. Sports Exerc., vol. 50, no. 7, pp. 1518–1524, 2018. https://doi.org/10.1249/MSS.0000000000001578
[50] D. Fuller et al., “Predicting lying, sitting, walking, and running using Apple Watch and Fitbit data,” BMJ Open Sport Exerc. Med., vol. 7, no. 1, Art. no. e001004, 2021.
https://doi.org/10.1136/bmjsem-2020-001004
[51] U.K. Chief Medical Officers, “UK Chief Medical Officers’ Physical Activity Guidelines,” Department of Health and Social Care, London, U.K., 2019. Available from: https://www.gov.uk/government/publications/physical-activity-guidelines-uk-chief-medical-officers-report (Accessed on: 2026 Aug 9).
[52] D. Anguita, A. Ghio, L. Oneto, X. Parra, and J. L. Reyes-Ortiz, “A public domain dataset for human activity recognition using smartphones,” in Proc. ESANN, 2013. Available from: https://archive.ics.uci.edu/dataset/240/human+activity+recognition+using+smartphones (Accessed on: 2026 Aug 9).
[53] A. Reiss and D. Stricker, “Introducing a new benchmarked dataset for activity monitoring,” in Proc. Int. Symp. Wearable Comput. (ISWC), 2012. Available from: https://archive.ics.uci.edu/dataset/231/pamap2+physical+activity+monitoring (Accessed on: 2026 Aug 9).
[54] I. Goodfellow, Y. Bengio, and A. Courville, Deep Learning. Cambridge, MA, USA: MIT Press, 2016. Available from: https://mitpress.mit.edu/9780262035613/deep-learning/ (Accessed on: 2026 Aug 9).
[55] D. P. Kingma and J. Ba, “Adam: A method for stochastic optimisation,” in Proc. Int. Conf. Learn. Represent. (ICLR), 2015. Available from: https://arxiv.org/abs/1412.6980 (Accessed on: 2026 Aug 9).
[56] N. Srivastava et al., “Dropout: A simple way to prevent neural networks from overfitting,” J. Mach. Learn. Res., vol. 15, pp. 1929–1958, 2014. Available from: https://jmlr.org/papers/v15/srivastava14a.html (Accessed on: 2026 Aug 9).
[57] M. Abadi et al., “TensorFlow: Large-scale machine learning on heterogeneous distributed systems,” arXiv preprint arXiv:1603.04467, 2016. Available from: https://arxiv.org/abs/1603.04467 (Accessed on: 2026 Aug 9).
[58] F. Chollet et al., “Keras,” GitHub repository, 2015. Available from: https://github.com/keras-team/keras (Accessed on: 2026 Aug 9).
[59] M. T. Ribeiro, S. Singh, and C. Guestrin, “Why should I trust you?: Explaining the predictions of any classifier,” in Proc. 22nd ACM SIGKDD Int. Conf. Knowl. Discov. Data Min., 2016, pp. 1135–1144. https://doi.org/10.1145/2939672.2939778
[60] A. Shrikumar, P. Greenside, and A. Kundaje, “Learning important features through propagating activation differences,” in Proc. 34th Int. Conf. Mach. Learn. (ICML), 2017, pp. 3145–3153. https://proceedings.mlr.press/v70/shrikumar17a.html (Accessed on: 2026 Aug 9).
[61] C. Molnar, “Interpretable Machine Learning,” 2nd ed., 2022. https://christophm.github.io/interpretable-ml-book/ (Accessed on: 2026 Aug 9).
[62] T. Fawcett, “An introduction to ROC analysis,” Pattern Recognit. Lett., vol. 27, no. 8, pp. 861–874, 2006. https://doi.org/10.1016/j.patrec.2005.10.010
[63] T. Saito and M. Rehmsmeier, “The precision–recall plot is more informative than the ROC plot when evaluating binary classifiers on imbalanced datasets,” PLoS ONE, vol. 10, no. 3, Art. no. e0118432, 2015.
https://doi.org/10.1371/journal.pone.0118432
[64] D. M. W. Powers, “Evaluation: From precision, recall and F-measure to ROC, informedness, markedness and correlation,” J. Mach. Learn. Technol., vol. 2, no. 1, pp. 37–63, 2011. Available from https://fac.flinders.edu.au/items/90ac6613-2b25-4c9a-887a-7194da37e79c (Accessed on: 2026 Aug 9).
[65] N. V. Chawla, K. W. Bowyer, L. O. Hall, and W. P. Kegelmeyer, “SMOTE: Synthetic Minority Over-sampling Technique,” J. Artif. Intell. Res., vol. 16, pp. 321–357, 2002.
https://doi.org/10.1613/jair.953
[66] H. He and E. A. Garcia, “Learning from imbalanced data,” IEEE Trans. Knowl. Data Eng., vol. 21, no. 9, pp. 1263–1284, 2009. https://doi.org/10.1109/TKDE.2008.239
[67] B. Krawczyk, “Learning from imbalanced data: Open challenges and future directions,” Prog. Artif. Intell., vol. 5, pp. 221–232, 2016. https://doi.org/10.1007/s13748-016-0094-0
[68] O. D. Lara and M. A. Labrador, “A survey on human activity recognition using wearable sensors,” IEEE Commun. Surveys Tuts., vol. 15, no. 3, pp. 1192–1209, 2013. https://doi.org/10.1109/SURV.2012.110112.0019
[69] N. C. Krishnan, “Transfer learning for activity recognition: A survey,” Knowl. Inf. Syst., vol. 36, pp. 537–556, 2013. https://doi.org/10.1007/s10115-013-0665-3
[70] P. Woznowski, R. King, W. Harwin, and I. Craddock, “A human activity recognition framework for healthcare applications: Ontology, labelling strategies, and best practice,” in Proc. Int. Conf. Internet Things Big Data (IoTBD), 2016, pp. 369–377. https://doi.org/10.5220/0005932503690377
[71] A. Chaddad, J. Peng, J. Xu, and A. Bouridane, “Survey of explainable AI techniques in healthcare,” Sensors, vol. 23, no. 2, Art. no. 634, 2023. https://doi.org/10.3390/s23020634
[72] Streamlit, “Streamlit documentation,” Streamlit Inc., 2025. Available from: https://docs.streamlit.io/ (Accessed on: 2026 Aug 9).
[73] A. S. Hammad, A. Tajammul, I. Dergaa, and M. Al-Asmakh, “Machine learning applications in the analysis of sedentary behaviour and associated health risks,” Front. Artif. Intell., vol. 8, Art. no. 1538807, 2025.
https://doi.org/10.3389/frai.2025.1538807
[74] A. Nouriani, R. A. McGovern, and R. Rajamani, “Deep-learning-based human activity recognition using wearable sensors,” IFAC-PapersOnLine, vol. 55, no. 37, pp. 1–6, 2022. https://doi.org/10.1016/j.ifacol.2022.11.152
Licensed
© 2026 Copyright by the Authors.
Licensed as an open access article using a CC BY 4.0 license.
Article Contents Author Danish Rahman1, * Matias Garcia-Constantino1 1School of Computing, Ulster University, Belfast Campus, BT151AP, United Kingdom Article History:
Article Contents Authors Saqib Hussain Hadri1, Muhammad Hassnain1,* , Aqsa Arshed1, Shamaiza Kousar1, Aleeza Yasmeen1, Nuzhat Latif1, Kiran Ijaz1, Maryam
Article Contents Author Amal S. Al Saadi1, * 1Sohar University, Sohar, Oman Article History: Received: 13 June, 2026 Accepted: 09
Article Contents Author Olabode Adeyemi David1, * , Nduka Christiana1, Akazue Ruth Chioma1, Amos Mishael1 1Department of Animal Production,
Article Contents Author Muzmmil Memon1, * 1Department of Computer Science Management, Avila University, Kansas City, Missouri, United States Article History:
Article Contents Author Raza Hussain Khoso1, * 1Henry W. Bloch School of Management, University of Missouri-Kansas City, Missouri, United States