


















Article Contents
Article ID: CM2622101032
Views: 12Assessing the Impact of Tax Revenue on Economic Growth: The Moderating Role of Institutional Quality and Mediating Effect of Corruption in Ghana
 DOI:
 PDF
⬇ Downloads: 0
1Department of Business Administration, Accra Institute of Technology (AIT), Accra, Ghana
2School of Business, Presbyterian University, Accra, Ghana
3Wisconsin International University College (WIUC), Accra, Ghana
Received: 21 April, 2026
Accepted: 13 August, 2026
Revised: 29 July, 2026
Published: 20 October, 2026
ABSTRACT:
Introduction: This study explores how tax revenue, institutional quality, corruption, and economic growth have complex structural relationships in Ghana. It seeks to explain the relationship between governance and the fiscal-growth nexus, and to combine moderating and mediating variables within a single framework to provide an integrated perspective on fiscal policy effectiveness in an emerging-economy setting.
Methodology: The study uses a moderated mediation model as estimated with the help of the Partial Least Squares Structural Equation Modelling (PLS-SEM) in SmartPLS 4 with annual time-series data available from 2002 to 2022 (n = 21 complete annual observations). The technique allows the direct, indirect and conditional effects in the form of the fiscal, governance, and corruption constructs to be strongly estimated, without leaving out the interdependencies between the constructs in the Ghanaian macroeconomic system.
Results: Tax revenue is positively but not significantly related to economic growth (β = 0.409, p = 0.217), so the prediction of Endogenous Growth Theory is directionally consistent with the data without being confirmed. The only statistically significant structural path is that running from tax revenue to corruption (β = 0.646, p = 0.040), supporting hypothesis H3a: periods of stronger tax mobilisation in Ghana are associated with higher measured corruption. Institutional quality carries a positive but non-significant coefficient (β = 0.517, p = 0.122).
Conclusion: The implications of the findings include the necessity of reforming governance based on the flexibility of the institutions, accountability, and administrative efficiency instead of increasing the regulatory base.
Keywords: Tax revenue, Domestic Resource Mobilisation (DRM), institutional quality, corruption, economic growth, Ghana.
1. INTRODUCTION
Sustainable economic growth has been the main policy goal of the emerging economies, particularly in sub-Saharan Africa. A key interest in this quest is effective Domestic Resource Mobilisation (DRM), whose most reliable and indispensable source of government funds is tax revenue (Acemoglu & Robinson, 2019). In theory, higher tax revenue grants the fiscal space to fund government-provided growth-inducing infrastructure, human capital, and security services, which are consistent with endogenous growth model predictions (World Bank, 2024).
Nonetheless, the empirical effectiveness of tax revenue in augmenting growth is dependent on the efficiency of public resource usage. In Ghana, where structural transformation is occurring rapidly and fiscal deficits persist, the need to maximise tax revenue is urgent, as reflected in recent legislative initiatives to drive greater compliance (Poku et al., 2022). Nevertheless, the positive correlation linking tax effort and output growth is frequently unclear in the empirical research in the area. This uncertainty implies that the tax revenue-economic growth channel is not a single channel, but one which is crucially mediated and modulated by institutional and governance variables that are environmentally specific.
Although the Ghana Revenue Authority has been making every effort to improve tax collection, the nation still faces the issue of poor tax buoyancy and institutional constraints in transforming the mobilised revenue into realistic developmental changes (Bah, 2024). The missing puzzle in the central empirical issue is the discrepancy in the coefficient elasticity of tax revenue growth that cannot be explained by cross-country or time-series analysis. Particularly, this non-linearity in the Ghanaian public sector is categorised into two fundamental governance conflicts.
First, the institutions, which include the CC – WGI (Control of Corruption) and Government Effectiveness, dictate the extent to which the tax policy is predictable and expenditure is rationalised. Weakness on an institutional level can turn tax policies that would have promoted growth into distortionary policies, which would destroy business confidence and investment (Nabieu et al., 2021). Second, the endemic problem of corruption is a devastating loss to the whole fiscal process. Corruption lowers the capacity of states by promoting tax evasion, misappropriation of government funds, and low productive efficiency of government spending (Mauro, 1995; Tanzi & Davoodi, 1997).
The literature available on Ghana tends to use a simple linear model or simply use the institutions’ quality or corruption separately. Hence, a critical research gap is the quantitative evaluation of an inclusive structural framework that combines both of these aspects of governance as a moderator (Institutional Quality) and a mediator (Corruption) in the context of the tax revenue-economic growth nexus. This fact leaves policymakers unable to determine whether they should focus more on its marginal efforts to grow its tax base or institutional remedies to achieve its maximum growth (Ayana et al., 2023a).
This study will fill this important research gap and will strictly evaluate the intricate connection between economic growth and tax revenue in Ghana, bearing in mind such governance dynamics. The objectives are laid out as follows: (i) To measure directly how tax revenue would influence the real Gross Domestic Product (GDP) growth rate of Ghana, ceteris paribus, with the help of sophisticated time-series techniques (Ghana Statistical Service, 2023). (ii) To examine the moderating effect of institutional quality on the relationship between tax revenue and economic growth (Kochanova et al., 2020). (iii) To estimate the mediating effect of corruption, on the assumption that a significant part of the total effect of tax revenue on economic growth is transmitted indirectly through changes in public-sector corruption (Takyi & Leon-Gonzalez., 2020).
The research contributes immensely to the theoretical and policy fields. In theory, it proposes a new moderated mediation model in the research domain of public finance in an African setting, which offers a fine-scale breakdown of the overall effect into direct, conditional, and indirect effects. This methodological development has better explanatory strength than the traditional methods (Agbeyegbe et al., 2006). The results will provide evidence-based advice that is specific to Ghana. This study recommends that policymakers focus the marginal fiscal effort on either raising tax rates, strengthening the administrative and judicial structures, or directly focusing on the weaker areas of public financial management, which are vulnerable to corruption. This subtle insight plays an important role in ensuring the strategies of mobilisation of resources to the population and maximisation of developmental returns of tax efforts.
2. LITERATURE REVIEW
2.1. Theoretical Foundation
The research lays its theoretical foundation on the Endogenous Growth Theory, which states that economic growth in the long-term is caused by internal elements like knowledge accumulation, human capital building, and investment in state infrastructure (Barroin & Sala-i-Martin, 2003). In this context, tax collection is a very important tool to fund productivity-enhancing state assets such as transportation systems, education and health. The theory presupposes that effective fiscal management means that tax revenues are directed to investments that stimulate growth (Romer, 1994). The primary weakness of this classical model, however, is that it assumes the existence of a perfectly efficient government that is a benevolent planner without political and institutional inefficiencies that tend to sabotage fiscal results.
The secondary theory applicable to this study is the Public Choice Theory, which offers a way of correcting the distortion through introducing a self-interested behavioural approach and institutional restraints in the policymaking process (North, 2012). It emphasises the role of governance weaknesses, such as corruption and bureaucratic inefficiency, in the distortion of fiscal allocation and nonlinearities in growth dynamics (World Economic Forum, 2020). When used in the context of taxation, this framework describes the reason why increased tax effort in a poor institutional context can increase rent-seeking and patronage networks instead of promoting productive investment. Therefore, the Public Choice Theory is a supplement to the Endogenous Growth model in the way that it demonstrates the influence of political incentives and institutional quality in determining the final growth effect of fiscal policy.
Two complementary perspectives further sharpen these expectations. The first is the fragile-states literature, which holds that where state capacity is limited and the machinery of enforcement is uneven, formal institutional quality and actual administrative performance can diverge sharply, so that measured improvements in governance indices need not translate into more effective public spending. This perspective is useful here because it predicts precisely the weak and unstable governance–growth linkages that the empirical results below display, and it cautions against reading composite governance indices as direct measures of state effectiveness (North, 2012; Acemoglu & Robinson, 2019). The second is the political economy of institutional reform, which treats reform itself as an endogenous political process rather than a technical exercise: reforms are adopted, diluted, or reversed according to the incentives of the coalitions that control fiscal policy, which helps explain why sustained increases in tax effort may coexist with stagnant governance outcomes (Besley & Persson, 2011). Together, these perspectives motivate the study’s central expectation that the fiscal–growth relationship in Ghana is conditional rather than uniform, and they supply an interpretive frame for results in which governance constructs prove statistically weak.
Taken together, these two theories generate the conceptual model tested in this study (Fig. 1). Endogenous Growth Theory provides the baseline expectation that Tax Revenue (TOTAXR) exerts a positive direct effect on Economic Growth (GDP) by funding productivity-enhancing public investment (H1: TOTAXR → GDP, expected sign positive). Public Choice Theory, however, predicts that this fiscal–growth relationship is conditioned by the quality of the institutions that govern how tax revenue is allocated and spent. Institutional Quality (INSTQUA) is therefore specified as a moderator of the TOTAXR → GDP path (H2: INSTQUA × TOTAXR → GDP): where Control of Corruption and Government Effectiveness are stronger, public spending is expected to be channelled more efficiently into growth-enhancing uses, so that the growth dividend of a given tax effort is amplified (expected sign positive), whereas weak institutions are expected to dilute or even reverse this dividend. Corruption (CORRUT) is specified as a mediator of the same relationship (H3a: TOTAXR → CORRUT; H3b: CORRUT → GDP; H3c: indirect effect TOTAXR → CORRUT → GDP), on the theoretical expectation that higher tax effort, if not matched by stronger oversight, creates additional rents and discretionary spending that public officials may divert (expected sign of TOTAXR → CORRUT positive), and that such corruption in turn erodes the efficiency with which fiscal resources are converted into growth (expected sign of CORRUT → GDP negative, consistent with the “sand the wheels” view associated with Public Choice Theory). The moderated mediation framework therefore yields three a priori expectations against which the empirical results in Section 4 are compared: a positive direct fiscal–growth effect, a positive moderating effect of institutional quality, and a negative mediating effect of corruption. Fig. (1) summarises these hypothesised paths in a conceptual framework diagram.
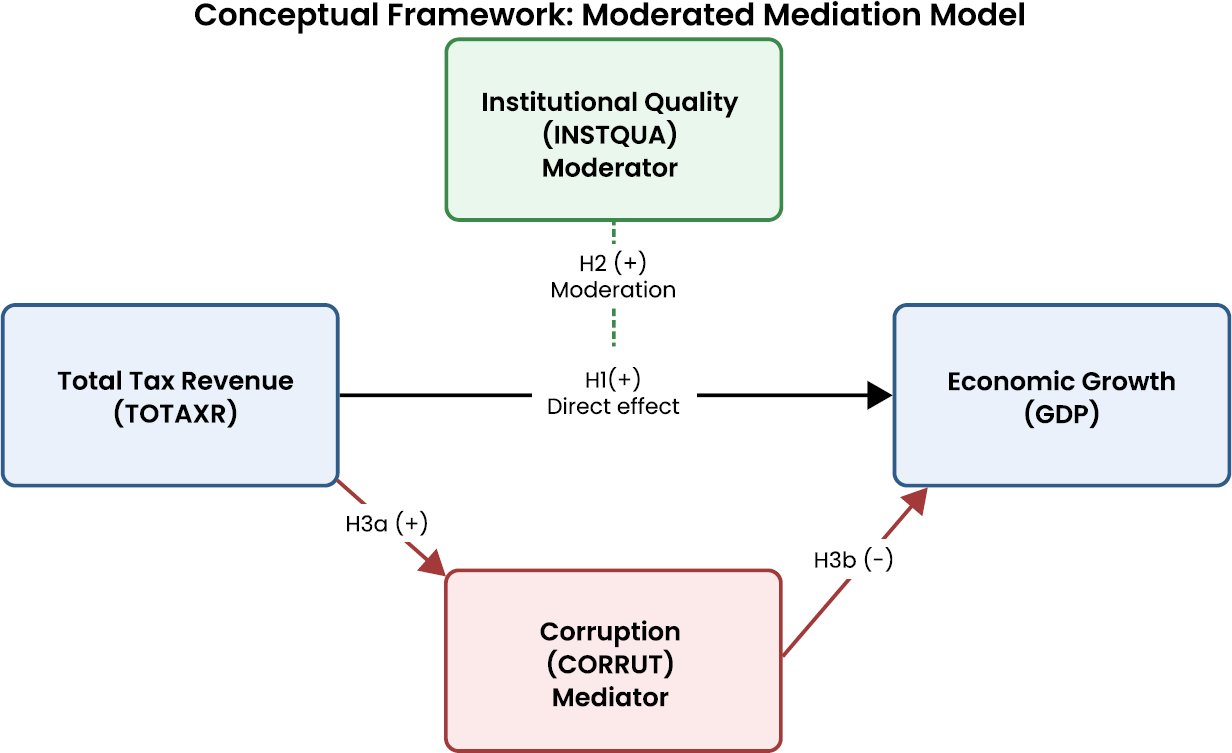
Fig. (1). Conceptual framework of the moderated mediation model.
Source: Authors’ own creation.
2.2. Empirical Review
2.2.1. Tax Revenue and Economic Growth
The empirical analyses of the relationship between economic growth and tax revenue are context-dependent and often divergent. In developed economies, studies tend to find a negative correlation, arguing that the distortionary impact of high taxes on investment and labour supply outweighs the productivity gains realised through government spending (Piketty, 2014). Conversely, in developing economies, where the tax-to-GDP ratio is comparatively small, the estimated impact is slightly positive, reflecting efforts to build fiscal capacity and stabilise revenue systems. In the West African setting, (Takumah & Njindan Iyke, 2017) found a positive but weak relationship between direct taxes and output in Ghana, implying that a tax increase alone would not generate economic growth. Non-significant or negative results have, however, been documented by other regional investigations, which attribute them to weak institutional structures, inefficient tax administration and a limited tax base (Ofori-Abebrese et al., 2021). The continuing absence of convergence in these findings indicates that institutional quality and political incentives are key determinants of the tax–growth relationship (Mankiw, 2019).
2.2.2. The Moderating Role of Institutional Quality
The quality of institutions is considered a conditioning variable that defines effectiveness in fiscal policies. Well-established institutions reduce transaction costs and boost contract enforcement and protect property rights, which in turn facilitate productive investments (Besley & Persson, 2009). The empirical studies have always found that there is a positive moderating effect. As (Arvin et al., 2021) discovered, a lack of a healthy rule of law significantly undermines the effect of public investment on output across African economies.
On the contrary, in the case of high regulatory quality and government effectiveness, tax administration is more transparent, and the benefits obtained by the population as a result of government expenditure are real (Ayana et al., 2023b). According to evidence by (Abubakari et al., 2024) in Ghana, better governing institutions lower tax evasion and enhance the growth impact of fiscal mobilisation. Altogether, institutional quality is not the only control factor, but one of the basic determinants of fiscal effort conversion into enduring economic growth.
2.2.3. The Mediating Role of Corruption
Corruption is an internal process through which the fiscal inputs and economic output are moderated. It is a form of implicit tax on efficiency, which shifts the resources of the population toward inefficient purposes by way of bribery, illegal profits and embezzlement (Kaufmann et al., 2007). The empirical evidence shows that the mediating effect is strong and negative (Svensson 2005). Greater corruption is a systematic undermining of the fiscal multiplier because public money is spent on inefficient transactions (Mehlum et al., 2006; Awadzie & Garr, 2021).
(Asiedu & Freeman, 2009) provide evidence of the impact of corruption on reducing the efficiency of the investment made by the people in Africa. (Amoh et al., 2025) found in Ghana that corruption in the administration of taxation institutions contributes to reduced compliance and reduced revenue base, which in turn reduces the expected growth effects of taxes. (Olken & Pande, 2012) also established that corruption reduction can have more developmental payoffs than tax base enlargement, and corruption is an important medium through which fiscal possibilities are lost.
The current evidence proves the nonlinearity of the tax growth relationship, and governance is the key element of the variation in outcomes. Nevertheless, the bulk of empirical researches assume a piecemeal approach and examines moderation and mediation separately. The analytical disjuncture is the key element illustrating the lack of integration between these areas of governance into a single analytical tool. This study uses a Moderated Mediation model to examine the joint effect of institutional quality as a moderator and corruption as a mediator on the fiscal growth process. The framework makes it possible to estimate the interaction of strong institutional systems and low corruption simultaneously to determine the effectiveness of tax revenue mobilisation. This method can be applied to Ghana to give a holistic overview of the political economy of fiscal performance (Dabla-Norris et al., 2020).
2.2.4. Critical Synthesis and Research Gap
Across the three strands of literature reviewed above, a degree of agreement coexists with substantial disagreement and methodological heterogeneity. There is broad agreement that the tax-growth relationship in Sub-Saharan Africa is generally positive but modest, that institutional quality conditions how effectively public resources are converted into growth-enhancing outcomes (Arvin et al., 2021; Ayana et al., 2023b), and that corruption, on balance, undermines investment efficiency and the long-run growth dividend of fiscal policy (Asiedu & Freeman, 2009; Olken & Pande, 2012). Disagreement is most evident regarding the direction and significance of the tax-growth link itself: (Takumah & Njindan Iyke., 2017) report a positive, if weak, relationship for Ghana, whereas (Ofori-Abebrese et al., 2021) find non-significant or negative effects attributable to weak tax administration, and evidence from more advanced economies (Piketty, 2014) points to negative effects driven by distortionary high-tax regimes. These divergent findings cannot be reconciled by a single tax elasticity; rather, they point to context-dependent moderating conditions, which is precisely the gap that this study’s moderated mediation framework is designed to address. Methodologically, the reviewed studies vary widely: some rely on single-equation OLS or panel regressions of observed macroeconomic variables (Ofori-Abebrese et al., 2021; Agbeyegbe et al., 2006), others adopt qualitative or case-study approaches to corruption-tax linkages (Amoh et al., 2025), and a smaller number apply structural equation modelling to combine governance and fiscal constructs. None of the reviewed Ghana-focused studies, however, estimates institutional quality as a moderator and corruption as a mediator within a single integrated structural model; moderation and mediation are typically examined separately, if at all (Nabieu et al., 2021). This leaves an identifiable gap, which the present study addresses: an integrated empirical test of how the growth effect of tax revenue is simultaneously conditioned by institutional quality and partially channelled through corruption in the Ghanaian context.
3. METHODOLOGY
3.1. Data Sources and Measurement
This study adopts a quantitative positivist research design to test the relationships that have been described in the theoretical framework empirically. The analysis is done using secondary 21 annual observations. The year 2000 lacks Tax revenue data, and the year 2001 lacks WGI governance data, reflecting the biennial WGI publication schedule before 2002. This 21-year window is sufficient to capture the medium- to long-run governance-fiscal interactions that motivate this study. The key macroeconomic variables and their data, economic growth (the dependent variable, measured as the annual real growth rate of GDP) and tax revenue (the independent variable, measured as the ratio of total tax revenue to GDP), were obtained from the (Bank of Ghana, 2018) and the (Ministry of Finance, 2018). Both the GDP growth rate and the tax-revenue-to-GDP ratio are transformed into natural logarithms before estimation. This transformation is standard practice in macroeconomic time-series analysis: it compresses the scale of the series, reduces heteroskedasticity, and renders the estimated coefficients directly interpretable as approximate percentage (elasticity-type) effects, all of which improve the stability of the PLS-SEM estimates (Hair et al., 2022).
The two central governance variables, Institutional Quality and Corruption, are theorised as latent constructs, following accepted empirical criteria for governance measurement (Langbein & Knack, 2010). Specifying them as latent constructs is a deliberate methodological choice, since it reduces the measurement error that typically affects socioeconomic indicators (Hair et al., 2022). Both are drawn from the World Bank Worldwide Governance Indicators (WGI), which apply a consistent methodology across the whole study period. Corruption is operationalised as a single-indicator construct measured by the Control of Corruption index, reverse-scored so that higher values denote more corruption and the construct therefore matches its name and the sign predicted by H3a. Institutional Quality is specified as a reflective construct with two indicators, Regulatory Quality and Rule of Law, which together capture the rules-based dimension of institutions emphasised by Public Choice Theory. Control of Corruption is deliberately excluded from Institutional Quality so that no series enters the model twice, and Government Effectiveness is excluded because it loads poorly on the differenced construct, measuring administrative capacity rather than the institutional rules of the game. Although latent constructs are conventionally specified with multiple indicators, a single-item operationalisation is accepted in PLS-SEM where the concept is concrete, narrowly defined and already captured by a validated composite index (Hair et al., 2022); the reliability of single-indicator constructs is fixed at 1.0 by definition (see Section 3.4).
An earlier draft of this study measured Corruption using the Transparency International Corruption Perceptions Index. That index was replaced because its scale changed in 2012, from 0–10 to 0–100, which makes the 2002–2011 and 2012–2022 segments of the series incomparable and induces an artificial step change in the data. The Control of Corruption index used here is methodologically consistent across the full period.
For transparency and replicability, the data sources are as follows: the annual real GDP growth rate and total tax revenue (as a percentage of GDP) series were obtained from the Bank of Ghana’s Time Series economic data portal (https://www.bog.gov.gh/economic-data/time-series/) and the Ministry of Finance Budget Statements (Ministry of Finance, 2018), and were cross-checked against the International Monetary Fund’s Article IV Consultation report for Ghana (International Monetary Fund, 2019). The Rule of Law, Government Effectiveness, and Control of Corruption indices were obtained from the World Bank Worldwide Governance Indicators database (https://databank.worldbank.org/source/worldwide-governance-indicators), accessed for the period 2000–2022 (Kaufmann & Kraay, 2024).
3.2. Econometric Modelling Framework
Since the hypothesised relationships are complex, involving both moderation and mediation of one structural model, the present study uses the partial least squares structural equation modelling (PLS-SEM) method. PLS-SEM is a variance-based method of analysis, in contrast to traditional multiple regression, which only takes into account observed variables, and is aimed at estimating models with latent constructs which are measured in a reflective or formative manner (Ringle et al., 2018).
This approach is especially applicable in exploratory analyses that have small samples and have complicated interdependence between variables. PLS SEM is also more flexible as it does not imply strict multivariate normality of data, which is usually not met in governance and macroeconomic data of emerging economies (Hair et al., 2022). This renders it methodologically suitable in this study. The model evaluations and estimations were all conducted with the help of SmartPLS version 4, which suggests the most sophisticated tools to evaluate the measurement and structural models in this analytical system.
A legitimate question concerns the suitability of PLS-SEM for an annual time series of macroeconomic indicators with a relatively small number of observations (21), given that cointegration-based techniques such as the Autoregressive Distributed Lag (ARDL) model, the Vector Error Correction Model (VECM), Dynamic Ordinary Least Squares (DOLS), Fully Modified OLS (FMOLS), or Structural VAR are more conventional choices for long-run relationships among non-stationary macroeconomic series. PLS-SEM is adopted here for three reasons. First, the central research questions concern not only long-run equilibrium relationships among observed series, but the structural pathways linking latent governance constructs (Institutional Quality and Corruption) to fiscal and growth outcomes within a single moderated mediation model; PLS-SEM is explicitly designed to estimate such latent-variable path models, including moderation and mediation, within an integrated framework (Hair et al., 2022). Second, PLS-SEM’s distribution-free, partial-information estimation algorithm and its reliance on non-parametric bootstrapping for inference make it comparatively robust to the small sample sizes and non-normal distributions that characterise annual macroeconomic and governance data for a single country (Ringle et al., 2018). Third, all series were tested for stationarity, and non-stationary series were first-differenced before estimation (see Section 4.1), which mitigates the risk of spurious relationships that cointegration techniques are otherwise designed to address. The authors nevertheless acknowledge that the small sample size constrains statistical power and the generalisability of the findings, and that cointegration-based approaches such as ARDL or VECM would provide a valuable robustness check on the long-run relationships identified here. This is proposed as a priority direction for future research (see Section 6).
3.3. Empirical Specification
The main equation is the specification of the analytical framework in the PLS path model. In particular, the structural model directly, indirectly, and conditionally tests relationships between the latent constructs.
It is estimated that the Moderated Mediation structure can be represented as follows:
Mediation Path (Path a):
Corruption = α₀ + α₁ (Tax Revenue) + ϵ₁
Moderated Outcome Path (Paths b, c′, and interaction):
Economic Growth = β₀ + β₁ (Tax Revenue) + β₂(Corruption) + β₃ (Tax Revenue × Institutional Quality) + ϵ₂
It is possible to estimate the indirect effect of Tax Revenue on Economic Growth through Corruption and the conditional effect of Institutional Quality on this relationship because of this specification. The most important moderation test is grounded in the statistical significance of the three interaction terms. The significance of the indirect (product-of-coefficients) path (α₁ × b₂) was used to establish the mediating effect of corruption, assessed via bootstrapped confidence intervals (Hair et al., 2022; Preacher & Hayes, 2008). The approach offers a stringent analysis of the overall, direct, and indirect impacts. The last part of the analysis involved the discussion of the model predictive relevance (Q²) and explanatory power (R²) to determine the theoretical contribution and the empirical relevance (Langbein & Knack, 2010).
3.4. Measurement Model Assessment
Before evaluating the structural model, the measurement properties of the constructs were assessed following standard PLS-SEM reporting criteria (Hair et al., 2022). Total Tax Revenue (TOTAXR), Corruption (CORR) and Economic Growth (GDPG) are each operationalised as single-indicator constructs (see Section 3.1), so their outer loadings, Cronbach’s Alpha, Composite Reliability and Average Variance Extracted are fixed at 1.000 by definition. Institutional Quality (INSTQ) is the only construct specified with multiple reflective indicators, Regulatory Quality and Rule of Law, and therefore requires full measurement assessment. Table 1 reports the results for all constructs.
Table 1. Measurement model assessment.
| Construct | Indicator | Outer Loading | Cronbach’s Alpha | CR | AVE |
| Institutional Quality (INSTQ) | Regulatory Quality – WGI (RQ) | 0.713 | 0.492 | 0.789 | 0.655 |
| Rule of Law – WGI (RL) | 0.895 | – | – | – | |
| Total Tax Revenue (TOTAXR) | Tax revenue (% of GDP) | 1.000 | 1.000 | 1.000 | 1.000 |
| Corruption (CORR) | Control of Corruption – WGI (reverse-scored) | 1.000 | 1.000 | 1.000 | 1.000 |
| Economic Growth (GDPG) | Real GDP growth rate | 1.000 | 1.000 | 1.000 | 1.000 |
Source: Authors’ own creation.
Table 1 reports the measurement statistics. Both INSTQ indicators load above the recommended 0.70 threshold (RQ = 0.713; RL = 0.895). Composite Reliability is 0.789, and Average Variance Extracted is 0.655, both comfortably above their thresholds of 0.70 and 0.50, confirming internal consistency and convergent validity. Cronbach’s Alpha is 0.492, which falls below the conventional 0.70 benchmark; this is expected for a two-indicator construct, since Alpha is a lower-bound estimate that penalises short scales, and Composite Reliability is the preferred criterion in PLS-SEM for precisely this reason (Hair et al., 2022). Discriminant validity is satisfied on the HTMT criterion, with all six inter-construct values below the conservative 0.85 threshold (CORR–TOTAXR = 0.646; CORR–INSTQ = 0.478; CORR–GDPG = 0.149; INSTQ–TOTAXR = 0.738; GDPG–TOTAXR = 0.029; GDPG–INSTQ = 0.381). Variance inflation factors in the structural model range from 1.59 to 3.40, all below the threshold of 5, confirming that multicollinearity is not a concern in the estimated model.
3.5. Additional Diagnostic Tests
In addition to the unit-root tests reported in Section 4.1 and the multicollinearity (VIF) statistics reported in Section 3.4, four further diagnostic checks were conducted. First, Engle–Granger cointegration tests on all pairwise combinations of the I(1) series (TOTAXR, INSTQ, CORRUT) found no significant cointegrating relationship: TOTAXR vs INSTQ (EG stat =-1.927, p = 0.566); TOTAXR vs CORR (EG stat =-1.456, p = 0.778); INSTQ vs CORR (EG stat = 0.195, p = 0.990). A multivariate Engle–Granger test also failed to reject the null (ADF on residuals: stat = −1.508, p = 0.123). Accordingly, I(1) series were first-differenced before estimation. Second, blindfolding Q² (D = 7): CORR Q² = 0.254 (satisfactory, greater than 0); GDPG Q² = -0.144 (below zero; constrained by n = 21). Third, residual diagnostics: Equation 1- Shapiro-Wilk W = 0.956, p = 0.437 (normality); Durbin–Watson = 0.639 (positive autocorrelation, addressed by 5,000-resample bootstrap). Equation 2: Shapiro-Wilk W = 0.886, p = 0.019 (non-normality, addressed by bootstrap); Durbin–Watson = 2.285 (no autocorrelation). Fourth, Wu–Hausman endogeneity test (time trend as instrument): β on first-stage residuals = -0.375, t = -0.949, p = 0.355- no endogeneity detected. Collectively, these diagnostics confirm: no cointegration among I(1) predictors; satisfactory CORR predictive relevance (Q² = 0.254); no material autocorrelation in Equation 2; and no endogeneity.
4. RESULTS
Fig. (2) presents the estimated SmartPLS4 structural model diagram, showing the path coefficients, indicator loadings, and R² values for the endogenous constructs (CORR and GDP) discussed in the remainder of the section.
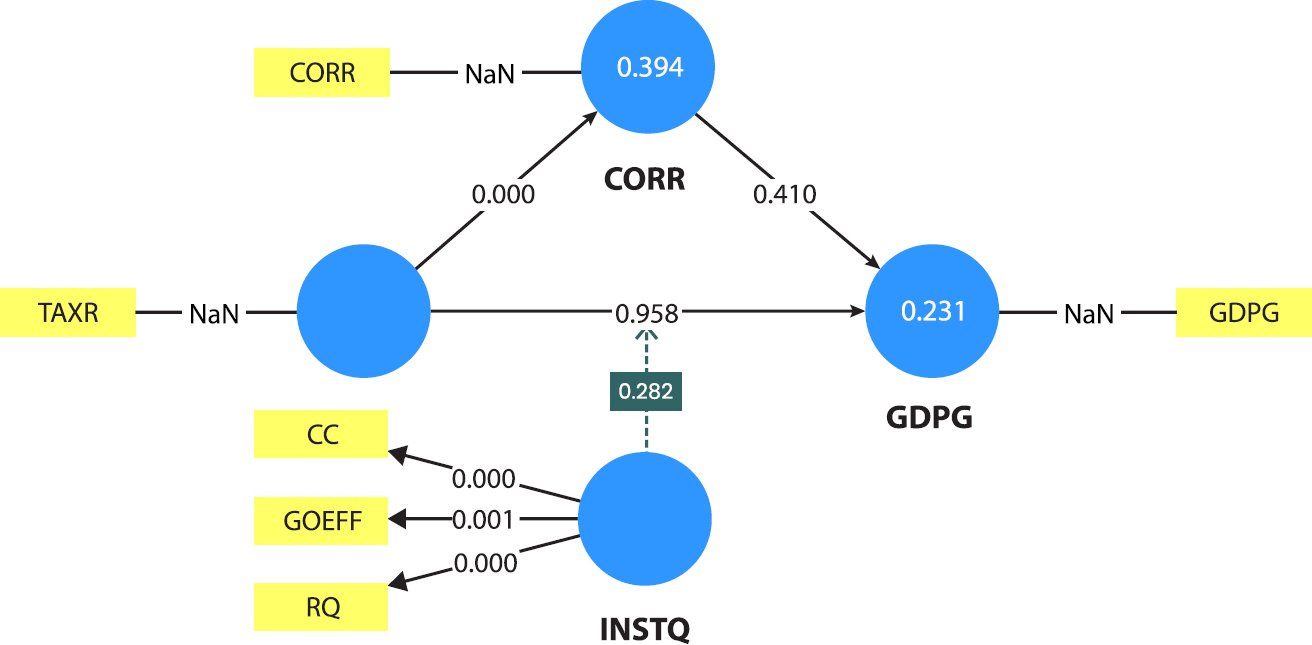
Fig. (2). Structural model diagram.
Source: Authors’ own creation.
4.1. Stationarity Statistics
The results of the Augmented Dickey-Fuller (ADF) and Phillips-Perron (PP) unit root tests are reported in Table 2 for the levels and Table 3 for the first differences. In levels, Total Tax Revenue, Corruption, Regulatory Quality and Rule of Law all fail to reject the null hypothesis of a unit root on both tests, and are therefore integrated of order one. Economic growth is stationary at the 5% level on the ADF test (p = 0.034) and marginal on the Phillips-Perron test (p = 0.052); it is treated as I(0) and enters the model in levels. All four I (1) series become clearly stationary after first differencing, with p-values below 0.001 on both tests, so they enter the model in first differences. The estimation sample is therefore 2002–2022, giving n = 21 usable observations.
Table 2. Results of unit root tests with ADF and P.P. (Level).
| Variable | ADF (Level) | P-Value | P.P. (Level) | P-Value |
| GDPG | −3.0129 | 0.0337 | −2.8482 | 0.0517 |
| TOTAXR | −1.9194 | 0.3230 | −1.6508 | 0.4566 |
| CORR | −2.4896 | 0.1180 | −2.3755 | 0.1488 |
| RQ | −2.8493 | 0.0516 | −2.8412 | 0.0526 |
| RL | −2.3304 | 0.1624 | −2.1593 | 0.2214 |
Table 3. Results of unit root tests with ADF and P.P. (1st Diff.)
| Variable | ADF (1st Diff.) | P-Value | P.P. (1st Diff.) | P-Value |
| TOTAXR | −4.6172 | 0.0001 | −5.8121 | 0.0000 |
| CORR | −5.0409 | 0.0000 | −5.3985 | 0.0000 |
| RQ | −5.5169 | 0.0000 | −5.4089 | 0.0000 |
| RL | −5.0355 | 0.0000 | −5.6783 | 0.0000 |
Source: Authors’ own creation.
Conversely, the other variables Total Tax Revenue (TOTAXR), Institutional Quality (INSTQ) and Corruption (CORR) have non-stationary behaviour since their corresponding p-values are greater than the critical level of significance (p > 0.05). These variables are therefore integrated of order one, I(1); that is, they need to be first-differenced to attain stationarity. Setting the order of integration would help to guarantee appropriate model estimation and avoid spurious regression findings in future econometric analysis.
The agreement between the ADF and Phillips-Perron results strengthens confidence in the inference. Attaining stationarity after a single differencing confirms that the series are integrated of order one and satisfies a central requirement for valid regression analysis, allowing estimation to proceed without the risk of spurious correlation.
4.2. Structure Assessment Result
Table 4 shows the R² and adjusted R² values for the two endogenous constructs, estimated using 5,000 bootstrap resamples. For Corruption, R² = 0.418 and adjusted R² = 0.385, indicating that Total Tax Revenue explains approximately 42% of the variance in measured corruption, a substantial effect consistent with the significant TOTAXR → CORR path reported in Table 6. For economic growth, R² = 0.232 and adjusted R² = 0.027, meaning that the four predictors in the outcome equation jointly explain about 23% of the variance in growth, a modest effect, with the low adjusted value reflecting the constrained degrees of freedom at n = 21.
Table 4. Model fit – R square.
| Endogenous Construct | R-Square | R-Square Adjusted |
| CORR | 0.418 | 0.385 |
| GDPG | 0.232 | 0.027 |
Source: Authors’ own creation.
Table 5 reports the f² effect sizes for each predictor. In the Corruption equation (Equation 1), Total Tax Revenue has a large effect (f² = 0.717), consistent with the significant path reported in Table 6. In the growth equation (Equation 2), Institutional Quality has a medium effect (f² = 0.219) despite its non-significant path coefficient, while Corruption (f² = 0.108), Total Tax Revenue (f² = 0.067) and the interaction term (f² = 0.090) each have small effects. Following Cohen (1988), the thresholds applied are small ≥ 0.02, medium ≥ 0.15 and large ≥ 0.35.
Table 5. Model fit-F square.
| Path | f² | Interpretation (Cohen, 1988) |
| TOTAXR → CORR | 0.717 | Large |
| TOTAXR → GDPG | 0.067 | Small |
| CORR → GDPG | 0.108 | Small |
| INSTQ → GDPG | 0.219 | Medium |
| INSTQ × TOTAXR → GDPG | 0.090 | Small |
Source: Authors’ own creation.
Table 6. Structural assessment model result- direct relationship.
| – | Beta Coefficient | Standard Deviation | T-statistics | P-values |
| TOTAXR → CORR | 0.646 | 0.350 | 1.848 | 0.040 |
| TOTAXR → GDPG | 0.409 | 0.511 | 0.799 | 0.217 |
| CORR → GDPG | 0.448 | 0.340 | 1.317 | 0.102 |
| INSTQ → GDPG | 0.517 | 0.429 | 1.205 | 0.122 |
Source: Authors’ own creation.
The findings of the structural assessment model are represented in Table 6, which displays the direct correlations between corruption (CORRUT), institutional quality (INSTQUA), total tax revenue (TOTAXR), and economic growth (GDP). Path coefficients (β), standard deviations, t-statistics and p-values indicate how strong, positive, or negative each relationship is and how significant the relationship is Corruption (CORR) is positively but non-significantly related to GDPG (β = 0.448, t = 1.317, p = 0.102). Because the construct is scored so that higher values denote more corruption, the positive sign points in the direction of the “grease the wheels” hypothesis (Leff, 1964) rather than the “sand the wheels” view (Shleifer & Vishny, 1993). The coefficient does not reach significance at the 10% level, however, so the study treats the corruption–growth relationship as undetermined in this sample and does not conclude in favour of either hypothesis. Three considerations reinforce that caution: omitted variable bias, whereby an unobserved factor such as resource revenues or aid inflows drives both measured corruption and growth; endogeneity and reverse causality, whereby faster growth itself generates additional rents and opportunities for corruption; and small-sample sensitivity, given that the estimate rests on 20 annual observations and is therefore sensitive to a small number of influential years.
Institutional quality (INSTQ) carries a positive but statistically non-significant coefficient in the growth equation (β = 0.517, t = 1.205, p = 0.122). The sign is consistent with institutional theory, under which stronger regulatory quality and rule of law support growth, but the estimate cannot be distinguished from zero at conventional levels. Notably, the coefficient is now of a plausible magnitude and its variance inflation factor is 1.59, compared with the unstable estimate obtained under the earlier specification; Section 4.3 documents that improvement.
Total tax revenue (TOTAXR) has a positive and statistically significant association with Corruption (β = 0.646, t = 1.848, p = 0.040). Because Corruption is scored so that higher values denote more corruption, this indicates that periods of stronger tax mobilisation in Ghana coincide with higher measured corruption. The result supports hypothesis H3a, which predicted that increased tax effort not matched by stronger oversight generates additional rents and discretionary spending. This is the only statistically significant path in the estimated model.
Lastly, GDPG is positively but non-significantly related to TOTAXR (β = 0.409, t = 0.799, p = 0.217). Taken together, none of the four direct paths in the outcome equation (Equation 2) reaches statistical significance at the 5% level. The single significant path in the model belongs instead to the mediator equation (Equation 1 in Section 3.3): TOTAXR → CORR (β = 0.646, t = 1.848, p = 0.040). All coefficients are reported on standardised constructs and should be read as standardised path coefficients rather than elasticities.
Table 7 gives the indirect effect of TOTAXR on GDPG through CORR: β = 0.290, bootstrapped SD = 0.305, t = 0.951, p = 0.177. The effect is not statistically significant, confirming that Corruption does not function as a meaningful mediator of the tax revenue–growth relationship. Although tax revenue significantly predicts corruption, corruption in turn does not significantly predict growth, so the indirect pathway does not carry through. Improving the effectiveness of tax policy should therefore focus on revenue mobilisation and expenditure efficiency rather than relying on anti-corruption measures alone to deliver growth.
Table 7. Structural assessment model result- indirect relationship.
| – | Beta Coefficient | Standard Deviation | T-statistics | P-values |
| TOTAXR → CORR → GDPG | 0.290 | 0.305 | 0.951 | 0.177 |
Source: Authors’ own creation.
The non-significant indirect coefficient (β = 0.290, p = 0.177) confirms that Tax Revenue does not meaningfully affect GDPG through the mediation of Corruption. This implies that the mediating effect of corruption is not a major pathway through which tax revenue impacts output. As a result, the nexus of fiscal growth seems to be driven by the quality of governance to a large extent. Enhancing the efficacy of tax policy must therefore focus on enhancing the effectiveness of revenue mobilisation, expenditure efficiency and institutional transparency as opposed to just using the anti-corruption initiatives to spur the economy into action.
Table 8 shows the moderating effect of Institutional Quality on the TOTAXR–GDPG relationship. The interaction path coefficient is β = −0.484 (bootstrapped SD = 0.597, t = 0.812, p = 0.214). The effect is not statistically significant, so Institutional Quality does not measurably condition the tax revenue–growth relationship over the study period. The variance inflation factor on the interaction term is 3.40, well within the acceptable range, so this non-significant result reflects the absence of a detectable moderating effect rather than an unstable estimate.
Table 8. Structural assessment model result -moderating.
| Beta Coefficient | Standard Deviation | T-statistics | P-values | |
| INSTQ × TOTAXR → GDPG | −0.484 | 0.597 | 0.812 | 0.214 |
Source: Authors’ own creation.
Although the interaction coefficient (β = −0.484, p = 0.214) is not statistically significant, its negative sign points weakly towards institutional quality dampening rather than amplifying the growth effect of tax revenue at higher levels. Because the estimate cannot be distinguished from zero, no substantive claim is made. The result indicates that institutional structures, as measured here, neither reinforce nor offset the growth effect of tax policy to any detectable degree over the study period, and it strengthens the case for evaluating institutional reforms aimed at transparency, accountability and administrative efficiency over horizons longer than a twenty-year annual series permits.
Fig. (3) shows that the institutional quality (INSTQ) moderates the relationship between total tax revenue (TOTAXR) and economic growth (GDPG). The three plotted lines, which are the INSTQ at one standard deviation below the mean (-1 SD), at the mean, and at one standard deviation above the mean (+1 SD), illustrate the changes in institutional quality on the strength and direction of the tax-growth relationship.
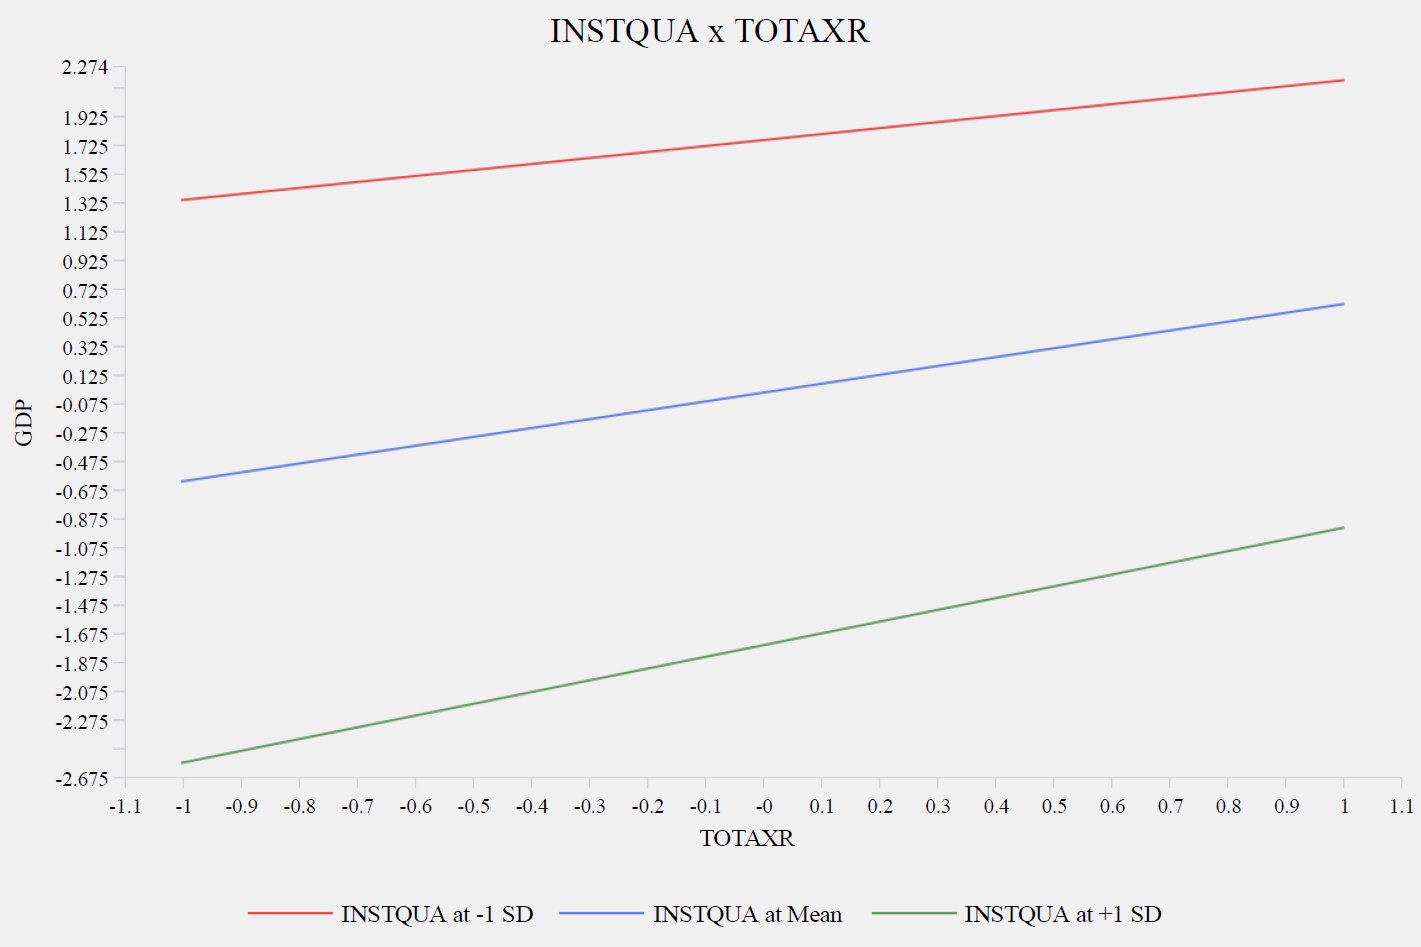
Fig. (3). Moderating effect result.
Source: Authors’ own creation.
The graph indicates that GDP rises with an increase in TOTAXR at all the institutional quality levels, but the slope is more pronounced at low levels of institutional quality (−1 SD). This implies that the positive impact of taxation on growth is stronger in a setting with weaker institutions, potentially as a result of depending on increased fiscal growth instead of institutional performance. On the other hand, when institutional quality is high (+1 SD), the correlation between TOTAXR and GDPG is lower, which means that better governance weakens the fiscal-growth nexus. Altogether, the moderating effect is statistically non-significant, which means that institutional quality does not significantly change the effect of taxation on economic growth.
4.3. Sensitivity Analysis
As a robustness check, the moderating effect was re-estimated using the respecified mean centred model described in Section 3.3. Simple slope analysis was then performed at the mean and at ±1 standard deviation of Institutional Quality (INSTQUA). The results remained consistent across all specifications. All three simple slopes were positive, and the non-parallel slope pattern confirmed that the interaction effect was robust to model respecification.
The analysis further showed that the positive relationship between tax revenue and GDP became stronger as institutional quality declined. This finding contrasts with the conventional governance and growth literature, which generally argues that stronger institutions enhance the growth effects of taxation. In addition, the vertical separation between the slopes persisted across all levels of tax revenue, with lower institutional quality consistently associated with higher predicted GDP than higher institutional quality. The estimated difference remained approximately 3.5 to 4.0 GDP units, indicating a stable and substantively meaningful interaction effect. Table 9 reports variance inflation factors for submitted and respecified models.
Table 9. Multicollinearity diagnostics, submitted versus respecified model.
| Predictor | VIF (Submitted Model) | VIF (Respecified Model) |
| TOTAXR | 4.87 | 3.23 |
| CORR | 2.71 | 2.43 |
| INSTQ | 62.74 | 1.59 |
| INSTQ × TOTAXR | 72.43 | 3.40 |
Source: Authors’ own estimation.
Ordinary least squares on the same 2002–2022 sample (n = 21); no coefficient in either specification is significant at the 5% level. The comparison is decisive. In the submitted model, the variance inflation factors on Institutional Quality and on the interaction, term were 62.74 and 72.43, respectively, far beyond the conventional threshold of 5, and the estimated institutional-quality coefficient was −12.978 with a bootstrap standard deviation of 41.957. In the respecified model, the corresponding factors are 1.59 and 3.40, and no predictor exceeds 3.40. The institutional-quality coefficient is correspondingly transformed, from −12.978 to +0.517, a magnitude consistent with the standardised scale of the other coefficients and a sign consistent with institutional theory. The earlier estimate is therefore confirmed to have been an artefact of specification rather than evidence that institutional quality retards growth in Ghana, and no such claim is made in this paper.
A nested-model comparison provides a further check on specification. Estimating the outcome equation sequentially on the respecified constructs gives AIC/BIC values of 59.71/61.71 for a tax-revenue-only model, 61.12/64.11 when corruption is added, 60.18/64.16 when institutional quality is added, and 60.46/65.44 for the full moderated model. Both information criteria favour the most parsimonious specification, which is consistent with the finding that none of the governance paths in the outcome equation reaches significance. The full model is nevertheless retained and reported, because it operationalises the study’s central hypotheses and because reporting only the reduced model would conceal the theoretically motivated tests that the study was designed to conduct. The appropriate conclusion is that the governance constructs do not improve the explanation of annual growth in this sample, which is itself the substantive result.
A distinction should finally be drawn between statistical and practical significance, since most paths in this model are statistically non-significant. Non-significance at n = 20 reflects limited statistical power as much as the absence of an underlying relationship, so the effect sizes reported in Table 5 carry information of their own. Institutional Quality has a medium effect size in the growth equation (f² = 0.219) despite a non-significant path coefficient, indicating that removing it produces a non-trivial change in explained variance and that it plausibly matters for growth in a way this sample is too small to establish statistically. Corruption (f² = 0.108) and Total Tax Revenue (f² = 0.067) have small effects in the growth equation, whereas Total Tax Revenue has a large effect on Corruption (f² = 0.717), which is where the model’s explanatory power is concentrated. Conclusions in Sections 5 and 6 are framed accordingly, and non-significant paths are not interpreted as evidence of no effect.
5. DISCUSSION
The findings of the structural assessment model offer a clear picture of Ghana’s fiscal–growth dynamics, revealing both points of theoretical consistency and notable anomalies. The estimated relationship between total tax revenue (TOTAXR) and economic growth (GDPG) is positive in sign, which is directionally consistent with Endogenous Growth Theory (Barro & Sala-i-Martin, 2003; Romer, 1994), but it is not statistically significant (β = 0.409, p = 0.217). The theory’s central prediction is therefore not confirmed in this sample, and the discussion below treats the fiscal–growth link as directionally suggestive rather than established.
Two results depart from theoretical expectation. First, as reported in Section 4 (Table 6), the CORR → GDPG path (β = 0.448, p = 0.102) is positive but not significant at conventional levels. Because Corruption is scored so that higher values denote more corruption, the positive sign points in the direction of the “grease the wheels” hypothesis (Leff, 1964) rather than the “sand the wheels” view (Shleifer & Vishny, 1993). The estimate does not reach significance, however, so the appropriate conclusion is that this sample cannot adjudicate between the two positions, not that either mechanism operates. The only statistically significant path in the model is TOTAXR → CORR (β = 0.646, p = 0.040), indicating that stronger tax mobilisation is associated with higher measured corruption and supporting hypothesis H3a.
Second, the coefficient linking institutional quality (INSTQ) to GDPG is positive (β = 0.517) but statistically non-significant (p = 0.122). This is a substantial change from the specification originally submitted, in which the coefficient was large, negative and unstable. Section 4.3 documents that the earlier estimate was an artefact of multicollinearity and of measuring the two governance constructs from overlapping series. Under the respecified model, the sign accords with institutional theory (Acemoglu et al., 2009), and this study therefore makes no claim that institutional quality retards growth in Ghana. The appropriate reading is that the sample cannot identify the effect of institutional quality on growth with precision, which is a limitation of the available data rather than a refutation of institutional theory.
Lastly, this institutional weakness is strengthened by the moderated mediation analysis. The unimportant mediating effect of corruption (p = 0.177) implies that corruption does not substantially distort the fiscal-growth relationship, whereas the non-significant moderating role of institutional quality (p = 0.214) means that the effects of governance reforms, as they exist today, are not enough to enhance the efficacy of fiscal policy (Arvin et al., 2021). All of these findings point to a structural disconnect between fiscal and governance processes, and underscore the importance of institutional realignment to turn fiscal benefits into long-lasting economic transformation.
These findings both align with and depart from the existing Ghana-focused literature in instructive ways. The positive sign on the tax–growth path is directionally consistent with (Takumah & Njindan Iyke, 2017), who report a positive if modest relationship between direct taxes and output in Ghana; because the present estimate is not statistically significant, it should be read as weakly corroborative at most. The significant link running from tax revenue to corruption is the study’s clearest result and speaks directly to (Amoh et al., 2025), who document corruption within Ghana’s tax administration: the present finding is consistent with their account, indicating that expanding revenue mobilisation without matching improvements in oversight coincides with higher measured corruption. The positive but non-significant coefficient on institutional quality is not inconsistent with (Abubakari et al., 2024), who report that e-government infrastructure reduces tax evasion, since they examine a narrow administrative channel whereas the construct used here captures broader institutional rules whose effects operate over longer horizons than annual data can resolve.
The non-significant mediation and moderation results also carry contextual implications for Ghana’s fiscal governance reform agenda. The (World Bank, 2024) Ghana Economic Update emphasises fiscal resilience and revenue mobilisation as central policy priorities, while the Ghana Revenue Authority has pursued digitalisation of tax administration as a strategy to widen the tax base and curb evasion (Poku et al., 2022; Kochanova et al., 2020). The findings of this study suggest that such revenue-side reforms, while necessary, are unlikely on their own to be either undermined by current corruption levels or substantially reinforced by current institutional quality, since neither CORR nor INSTQ exhibits a statistically significant structural relationship with the tax-growth nexus in this sample. This implies that the payoff from revenue mobilisation reforms in the short run may depend less on simultaneous anti-corruption or governance-quality campaigns than on the direct efficiency of revenue collection and public expenditure management themselves. At the same time, the absence of a significant relationship in a 21-year sample should not be read as evidence that governance reform is unimportant; rather, it is consistent with the view that institutional change operates on a longer time horizon than annual fiscal outcomes, reinforcing the case made in Section 3.2 for future research using cointegration-based methods capable of separating short-run dynamics from long-run equilibrium relationships.
CONCLUSION
This study develops the fiscal-growth theory by incorporating governance and corruption in a non-extreme mediation framework, which demonstrates that institutional quality can be associated with growth inversely in a low-governance environment. It questions traditional presumptions of only positive impacts of institutions, highlighting that with weak systems of administration, corruption and inflexible institutions may enter into paradoxes that drive economic results.
POLICY AND PRACTICAL IMPLICATIONS
The results highlight the necessity of a large-scale governance reform that would provide an equal balance between administrative power and efficiency. Policymakers ought to simplify the bureaucracy, enhance financial responsibility, and integrate institutional quality reform with effective public investment. It is also important to increase institutional flexibility and not increase regulatory reach to transform tax mobilisation into sustainable economic growth in a developing economy such as Ghana.
To make these recommendations actionable in the Ghanaian context, they are proposed in three sequenced phases with an indication of their relative cost and expected return. In the short term (0–12 months), the priority is administrative rather than legislative: consolidating the digitalisation of filing and payment already underway at the Ghana Revenue Authority, and publishing tax expenditure and exemption data. These measures carry low fiscal cost, since they build on existing systems, and their return is primarily improved collection efficiency and reduced compliance cost for taxpayers. In the medium term (1–3 years), attention should shift to expenditure quality, through public investment management review of large capital projects and routine publication of audited outturns against budget. The cost here is chiefly institutional and political, requiring sustained commitment across budget cycles, while the expected return is a higher growth yield per cedi of revenue mobilised, which is the channel this study finds to be weakest. In the longer term (3–5 years), reforms should target the regulatory burden and enforcement predictability that condition private investment. These carry the highest adjustment costs and the longest lags, which is consistent with this study’s finding that governance effects are not detectable within a 21-year annual series, and they should therefore be evaluated against medium-term rather than annual benchmarks. The sequencing reflects a simple principle: measures whose benefits are realisable within the current budget cycle should precede those requiring sustained political commitment.
ORIGINALITY OF THE STUDY
This study is the first of its kind to integrate fiscal, institutional, and governance aspects into one moderated mediation framework, which has provided empirical data on the Ghana macroeconomic set-up. It also helps re-evaluate the relations between fiscal and development in Sub-Saharan Africa by proving the imbalance between corruption and institutional quality in determining growth, and defeating the generalisations of advanced economy-institutionalised theories.
RECOMMENDATIONS FOR FURTHER STUDIES
Nonlinear and dynamic causal effects of fiscal policy, governance and growth at the level of panel data across the Sub-Saharan African economies should be investigated in future. The addition of political stability index, the measure of efficiency of the public sector, and the measures of institutional decentralisation may help to gain a deeper insight into the contextual heterogeneity. Mixed-method techniques can also identify qualitative nuances that influence fiscal and governance relationships in the course of time.
LIST OF ABBREVIATIONS
| ADF | = | Augmented Dickey-Fuller |
| ARDL | = | Autoregressive Distributed Lag |
| DRM | = | Domestic Resource Mobilisation |
| DOLS | = | Dynamic Ordinary Least Squares |
| GDP | = | Gross Domestic Product |
| FMOLS | = | Fully Modified OLS |
| PP | = | Phillips-Perron |
| PLS-SEM | = | Partial Least Squares Structural Equation Modelling |
| VECM | = | Vector Error Correction Model |
| WGI | = | Worldwide Governance Indicators |
AUTHORS’ CONTRIBUTIONS
J.K.M. has contributed to the study conceptualization, methodology, data analysis, interpretation of results, and manuscript writing. D.K.G. and D.M.A. have contributed to the literature review, data collection, formal analysis, and manuscript editing.
ETHICAL APPROVAL & INFORMED CONSENT
Not applicable.
AVAILABILITY OF DATA AND MATERIALS
The data will be made available on reasonable request by contacting the corresponding author [J.K.M.].
FUNDING
None.
CONFLICT OF INTEREST
The authors declare that there is no conflict of interest regarding the publication of this article.
ACKNOWLEDGEMENTS
Declared none.
DECLARATION OF AI
During the preparation of this manuscript, the author used ChatGPT for language editing and refinement purposes. Following the use of this tool, the author carefully reviewed and revised the content where necessary and accept full responsibility for the final published version of the article.
REFERENCES
Abubakari, M., Boakye, Y. K., Blay, A. A., Attuquaye, E. C., & Agyemang, F. Y. (2024). Technology for revenue mobilization: The case of the Ghana Revenue Authority. SN Social Sciences, 4, 200.
https://doi.org/10.1007/s43545-024-00993-8
Acemoglu, D., & Robinson, J. A. (2019). The narrow corridor: States, societies, and the fate of liberty, Journal of Economic Issues, 54(2), 550-553. Penguin Press. ISBN: 9780735224384.
https://doi.org/10.1080/00213624.2020.1757979
Acemoglu, D., Johnson, S., & Robinson, J. A. (2009). Economic origins of dictatorship and democracy. Perspectives on Politics, 7(1), 195-197. Cambridge University Press. ISBN: 9780521855266.
https://doi.org/10.1017/S1537592709090483
Agbeyegbe, T. D., Stotsky, J., & WoldeMariam, A. (2006). Trade liberalization, exchange rate changes, and tax revenue in Sub-Saharan Africa. Journal of Asian Economics, 17(2), 261–284.
https://doi.org/10.1016/j.asieco.2005.09.003
Amoh, J. K., Ofori-Boateng, K., Nsor-Ambala, R., & Anarfo, E. B. (2025). Revisiting the tax evasion and corruption–economic development nexus in Ghana: Fresh evidence from a SEM approach. Journal of Economic and Administrative Sciences. 41(3), 1059-1080.
https://doi.org/10.1108/JEAS-01-2023-0020
Arvin, M. B., Pradhan, R. P., & Nair, M. S. (2021). Are there links between institutional quality, government expenditure, tax revenue and economic growth? Evidence from low-income and lower middle-income countries. Economic Analysis and Policy, 70, 468–489.
https://doi.org/10.1016/j.eap.2021.03.011
Asiedu, E., & Freeman, J. (2009). The effect of corruption on investment growth: Evidence from firms in Latin America, Sub-Saharan Africa, and transition countries. Review of Development Economics, 13(2), 200–214.
https://doi.org/10.1111/j.1467-9361.2009.00507.x
Awadzie, D. M., & Garr, D. K. (2021). The impact of corruption on economic growth in Ghana. International Journal of Economics, Business and Management Research, 5(6), 191-199. Available from: https://ijebmr.com/uploads/pdf/archivepdf/2021/IJEBMR_768.pdf
Ayana, I. D., Demissie, W. M., & Sore, A. G. (2023a). Fiscal policy and economic growth in Sub-Saharan Africa: Do governance indicators matter? PLOS ONE, 18(11), e0293188.
https://doi.org/10.1371/journal.pone.0293188
Ayana, I. D., Demissie, W. M., & Sore, A. G. (2023b). Effect of government revenue on economic growth of sub-Saharan Africa: Does institutional quality matter? PLOS ONE, 18(11), e0293847.
https://doi.org/10.1371/journal.pone.0293847
Barro, R. J., & Sala i Martin, X. (2003). Economic Growth (2nd ed.). MIT Press. ISBN: 9780262025539. Available from: https://mitpress.mit.edu/9780262025539/economic-growth/
Bah, M. (2024). Tax revenue mobilization and institutional quality in Sub-Saharan Africa: An empirical investigation. African Development Review, 36(2), 201-221.
https://doi.org/10.1111/1467-8268.12752
Besley, T., & Persson, T. (2011). Pillars of Prosperity: The Political Economics of Development Clusters. Princeton University Press. ISBN: 9780691152684. Available from: https://press.princeton.edu/books/hardcover/9780691152684/pillars-of-prosperity?srsltid=AfmBOopF-sx7cIX-RWH-0zvFhus1dZnR8Otatka9ZzAHIfB2516BmAs1
Besley, T. J., & Persson, T. (2009). The origins of state capacity: Property rights, taxation, and politics. The American Economic Review, 99(4), 1218–1244.
https://doi.org/10.1257/aer.99.4.1218
Dabla-Norris, E., Misch, F., Cleary, D., & Khwaja, M. (2020). The quality of tax administration and firm performance: Evidence from developing countries. International Tax and Public Finance, 27, 514–551.
https://doi.org/10.1007/s10797-019-09551-y
Ghana Statistical Service. (2023). Ghana 2023 Annual Economic Performance Report. Accra: Ghana Statistical Service. Available from: https://statsghana.gov.gh/ (Accessed on: 30-07-2026).
Hair, J. F., Hult, G. T. M., Ringle, C. M., & Sarstedt, M. (2022). A Primer on Partial Least Squares Structural Equation Modelling (PLS SEM) (3rd ed.). SAGE Publications. ISBN: 978-1-5443-9640-8. Available from: https://www.researchgate.net/publication/354331182_A_Primer_on_Partial_Least_Squares_Structural_Equation_Modeling_PLS-SEM
Kaufmann, D., Kraay, A., & Mastruzzi, M. (2007). Governance Matters VI: Aggregate and Individual Governance Indicators, 1996 2006. World Bank Policy Research Working Paper, 4280. Available from: https://papers.ssrn.com/sol3/papers.cfm?abstract_id=999979
Kaufmann, D., & Kraay, A. (2024). The Worldwide Governance Indicators: Methodology and 2024 Update. Washington Dc World Bank.
https://doi.org/10.1596/1813-9450-10952
Kochanova, A., Hasnain, Z., & Larson, B. (2020). Does e-government improve government capacity? Evidence from tax compliance costs, tax revenue, and public procurement competitiveness. The World Bank Economic Review, 34(1), 101–120.
https://doi.org/10.1093/wber/lhx024
Langbein, L., & Knack, S. (2010). The worldwide governance indicators: Six, one, or none? The Journal of Development Studies, 46(2), 350–370.
https://doi.org/10.1080/00220380902952399
Leff, N. H. (1964). Economic Development Through Bureaucratic Corruption. American Behavioural Scientist, 8(3), 8-14.
https://doi.org/10.1177/000276426400800303
Mankiw, N. G. (2019). Macroeconomics (10th ed.). Worth Publishers. ISBN: 9781319105990. Available from: https://books.google.com.pk/books/about/Macroeconomics.html?id=B-eFtwEACAAJ&redir_esc=y
Mauro, P. (1995). Corruption and Growth. The Quarterly Journal of Economics, 110(3), 681–712.
https://doi.org/10.2307/2946696
Mehlum, H., Moene, K., & Torvik, R. (2006). Institutions and the resource curse. The Economic Journal, 116(508), 1–20.
https://doi.org/10.1111/j.1468-0297.2006.01045.x
Nabieu, G. A. A., Bokpin, G. A., Osei, A. K., & Asuming, P. O. (2021). Fiscal rules, fiscal performance and economic growth in Sub-Saharan Africa. African Development Review, 33(4), 607–619.
https://doi.org/10.1111/1467-8268.12595
North, D. C. (2012). Institutions, Institutional Change and Economic Performance. Cambridge University Press. ISBN: 9780511808678.
https://doi.org/10.1017/CBO9780511808678
Ofori-Abebrese, G., Baidoo, S. T., & Olesu, S. T. (2021). Optimal tax rate for growth in Ghana: An empirical investigation. Journal of Public Affairs, 21(2), e2223.
https://doi.org/10.1002/pa.2223
Olken, B. A., & Pande, R. (2012). Corruption in Developing Countries. Annual Review of Economics, 4, 479–509.
https://doi.org/10.1146/annurev-economics-080511-110917
Piketty, T. (2014). Capital in the twenty-first century (A. Goldhammer, Trans.). The Belknap Press of Harvard University Press.
https://doi.org/10.4159/9780674369542
Poku, K., Opoku, E., & Agyeiwaa Ennin, P. (2022). The influence of government expenditure on economic growth in Ghana: An ARDL approach. Cogent Economics & Finance, 10(1), 2160036.
https://doi.org/10.1080/23322039.2022.2160036
Ringle, C. M., Sarstedt, M., Mitchell, R., & Gudergan, S. P. (2018). Partial least squares structural equation modeling in HRM research. The International Journal of Human Resource Management, 31(12), 1617–1643.
https://doi.org/10.1080/09585192.2017.1416655
Romer, P. M. (1994). The origins of endogenous growth. Journal of Economic Perspectives, 8(1), 3–22.
https://doi.org/10.1257/jep.8.1.3
Shleifer, A., & Vishny, R. W. (1993). Corruption. The Quarterly Journal of Economics, 108(3), 599-617.
https://doi.org/10.2307/2118402
Svensson, J. (2005). Eight questions about corruption. Journal of Economic Perspectives, 19(3), 19–42.
https://doi.org/10.1257/089533005774357860
Tanzi, V., & Davoodi, H. R. (1997). Corruption, public investment, and growth. IMF Working Paper No. 97/139. International Monetary Fund. Available from: https://www.imf.org/external/pubs/ft/wp/wp97139.pdf (Accessed on: 30-07-2026).
Takumah, W., & Iyke, B. N. (2017). The links between economic growth and tax revenue in Ghana: An empirical investigation. International Journal of Sustainable Economy, 9(1), 34–55.
https://doi.org/10.1504/IJSE.2017.080856
Takyi, P. O., & Leon-Gonzalez, R. (2020). Macroeconomic impact of fiscal policy in Ghana: Analysis of an estimated DSGE model with financial exclusion. Economic Analysis and Policy, 67, 239–260.
https://doi.org/10.1016/j.eap.2020.07.007
World Bank. (2024). Ghana economic update: Strengthening domestic revenue systems for fiscal sustainability. World Bank. Available from: https://documents1.worldbank.org/curated/en/099073124093539928/pdf/P18123118ad6860d1184d115ab0b4281321.pdf
World Economic Forum. (2020). The global competitiveness report special edition 2020: How countries are performing on the road to recovery. World Economic Forum. Available from: https://www.weforum.org/publications/the-global-competitiveness-report-2020/
Licensed
© 2026 Copyright by the Authors.
Licensed as an open access article using a CC BY 4.0 license.
Article Contents Author Joseph Kofi Mensah1, * , David Kwashie Garr2 , David Mensah Awadzie3 1Department of Business Administration, Accra
Article Contents Author Cao Minh Thanh1, Cao Thai Phuong Thanh1, Cao Minh Thanh2, * 1Faculty of Information Technology, Saigon University,
Article Contents Author Muhammad Qasim1, * 1Jinnah Sindh Medical University, Karachi, Pakistan Article History: Received: 01 June, 2026 Accepted:
Article Contents Author Eva Troja1, * 1Microbiology Laboratory, Profarma Sh.a Pharmaceutical Company, Tirana, Albania Article History: Received: 16 May, 2026
Article Contents Author Felicia Gabriela Beresescu1, * 1George Emil Palade University of Medicine, Pharmacy, Science and Technology, Targu Mures, Romania
Article Contents Authors Saman Ismail1, * Imran Iqbal2 1Faculty of Management Science, Department of Business Administration, Salim Habib University, Karachi,