











Article Contents
Article ID: CM2601108003
Views: 87Chia Microgreen Powder Enriched Whole Wheat Chapatti: Sensory Acceptability and Nutritional Characterization
 PDF
⬇ Downloads: 3
1Department of Foods and Nutrition, Government Home Science College, Chandigarh, India
Received: 07 September, 2026
Revised: 30 September, 2026
Accepted: 22 October, 2026
Published: 29 October, 2026
ABSTRACT:
Introduction: Microgreens, young edible seedlings harvested after germination, are reported to concentrate vitamins, minerals, and bioactive phytochemicals at levels frequently exceeding those of mature plants. Chia (Salvia hispanica L.) microgreens contain phosphorus, protein, phenolics, magnesium, zinc, calcium, and iron. As chapatti is a staple food consumed daily in most Indian households, its enrichment with microgreen powder offers a practical route to improve micronutrient intake and address “hidden hunger”.
Materials and Methods: Chia seed microgreens were grown and milled to a dry powder, which was added to whole wheat chapatti at 0% (control), 9, 25, 31, 39, 47, and 67 percent. Trained and semi-trained panelists rated all formulations on a 9-point hedonic scale of aroma, texture, color, overall acceptability, and taste, and the most acceptable formulation was compared to the control in proximate composition, minerals, vitamins, total polyphenols, and antioxidant activity.
Results: The formulation containing 6 g of chia microgreen powder and 19 g of whole wheat flour achieved the highest overall sensory acceptability score (7.36) and was selected for further nutritional and biochemical analysis. Compared with the control chapatti, the fortified chapatti exhibited higher protein content (19.90 vs. 6.0 g), iron (95.8 vs. 1.9 mg), calcium (905 vs. 33 mg), zinc (9.1 vs. 0.16 mg), magnesium (581 vs. 61.5 mg), and phosphorus (981 vs. 110.28 mg). Dietary fiber increased from 3.2 to 4 g, while energy content increased from 229 to 304 kcal. The fortified chapatti also showed higher vitamin A content (1.79 vs. 0.60 mg) and folate content (56 vs. 10 µg). Vitamin C was detected in the fortified chapatti (5.54 mg) but was absent in the control. Furthermore, total polyphenol content increased from 2.6 to 14.93 mg GAE/g, while antioxidant activity increased from 60% to 73.63%.
Discussion: The nutrient levels align with the known ability of microgreens to be enriched in vitamins, minerals, and bioactive phytochemicals, and with the mobilization of seed reserves and decreasing antinutrients during sprouting. The results justify food-to-food fortification of daily staples as a viable approach to address micronutrient deficiency.
Conclusion: Adding chia seed microgreen powder to whole wheat chapatti increased its nutrient content without changing its taste, suggesting that microgreens can be used as natural fortifiers in staple cereal foods to address micronutrient deficit.
Keywords: Chapatti, chia (Salvia hispanica L.), fortification, functional food, microgreens, nutritional composition, sensory evaluation.
1. INTRODUCTION
Hidden hunger, the chronic deficiency of essential vitamins and minerals in diets that are otherwise adequate in energy, remains one of the world’s most intractable public health problems. Hidden hunger affects 2 billion developing-world individuals due to Fe, Zn, vit A, and folate deficits [1], and more general estimates a global burden of micronutrient malnutrition at over 3 billion people [2]. Since most diets are made up of starchy staple crops, which are sources of energy but few bioavailable micronutrients, staple-based interventions are commonly considered the most likely method to enhance dietary quality [1]. Supplementation programs, despite their importance, are dependent on external funding, purchasing power, market access, and consumer awareness and have failed to meet international targets [3]. Fortifying the staple foods themselves with nutrient-rich natural ingredients thus provides a more sustainable approach to correcting micronutrient malnutrition [2].
One such ingredient is microgreens, young edible seedlings of vegetables, cereals, and herbs harvested 7–21 days after germination, when the cotyledons have fully matured and, in most species, the first edible leaves have emerged [4]. In the 1980s, San Francisco chefs started serving them, but now they are grown commercially and considered “superfoods” [5]. Microgreens have a short production cycle and a high nutrient content: they contain more tocopherols, anthocyanins, ascorbic acid, minerals, glucosinolates, carotenoids, folate, vitamins, and phylloquinones than mature plants [6]. They likewise harbour minerals such as magnesium, iron, calcium, zinc, and selenium, along with vitamins such as α-tocopherol and ascorbic acid [7]. The combination of this nutrient density with the biochemical modification that occurs during germination is the basis of their move into farm-to-fork and their increasing application as functional ingredients [8]. Frequent intake of microgreens has therefore been associated with guarding against malnutrition, inflammation, and chronic illnesses like cardiovascular disease, diabetes, and obesity [9].
Microgreens such as pseudocereals and cereals, including chia, wheat, barley, amaranth, oats, quinoa, and barley, have much higher protein, mineral, and antioxidant concentrations compared to their adult counterparts [10]. One of them is chia (Salvia hispanica L.) microgreens, which are not only rich in protein, iron, calcium, magnesium, phosphorus, zinc, and phenolic compounds, but the powder of chia microgreens was defined as containing 34.7% protein, 13.63 mg gallic acid equivalents/100 grams of phenolics, and such major minerals as calcium, phosphorus, zinc, and iron [11]. Adding up to 5% chia microgreen powder to wheat noodles produced a favorable outcome [11].
Chapatti, an unleavened whole wheat flatbread, is eaten in most Indian households daily and is a convenient, inexpensive means of adding more micronutrients to the diet. Microgreens enhance the flavour, texture and color of flatbreads and other staple preparations [5]; microgreen-based cereal products such as biscuits and snack bars have shown acceptable sensory quality and improved nutritional profiles [12, 13]. Previous studies have explored the incorporation of microgreens and plant-derived powders into various cereal-based food products. Chia microgreen powder has been investigated in wheat noodles, with favourable outcomes reported at incorporation levels of up to 5% [11]. Other studies have examined microgreen enrichment in biscuits, snack bars, muffins, and steamed bread [12, 13], while research on cabbage powder-fortified flatbreads and mushroom powder-enriched tortillas has demonstrated the potential of plant-based ingredients to improve the nutritional profile of cereal-based products while maintaining sensory acceptability.
Building on this research, the present study investigates the incorporation of chia microgreen powder into whole wheat chapatti, an important staple food in India. It evaluates different incorporation levels to identify the most acceptable formulation and subsequently assesses its nutritional composition and bioactive properties in comparison with an unfortified control.
1.1. Objectives
- To cultivate chia (Salvia hispanica) seed microgreens and prepare dried chia microgreen powder.
- To formulate and develop chapatti enriched with chia microgreen powder.
- To evaluate the sensory acceptability of the developed chapatti formulations and identify the most acceptable formulation.
- To assess the nutritional composition and bioactive properties of the selected formulation.
2. MATERIALS AND METHODS
2.1. Materials
Chia seeds (Salvia hispanica L.) were obtained from Chandigarh market, and whole wheat flour was obtained from the Raipur Khurd market. The seeds were then carefully examined to ensure uniformity, and those seeds that were not contaminated by debris, broken grains, or other impurities were chosen; the rinsing of the seeds under running water was carried out thoroughly to remove dust and other surface contaminants before processing.
2.2. Cultivation of Chia Microgreens and Preparation of Microgreen Powder
The dried seeds were then immersed in fresh, clean water at room temperature (around 25- 30 °C) to ensure the seeds were moisturized sufficiently and to start metabolic processes that led to germination. The water was drained after it was soaked, and the hydrated seeds were rinsed again with fresh water. The seeds were then placed in clean cultivation trays containing coco peat as the growing substrate. Muslin cloth was not used to minimize the risk of fungal growth and to maintain appropriate sanitation during cultivation. The seeds were then placed in a clean plate lined with slightly moistened tissue paper and stored in the dark at room temperature (25- 30 °C) to facilitate germination; sprouting was induced in 24-48 h. Following germination, the trays were maintained under alternating light and dark exposure, with the microgreens kept in daylight for approximately half of the day and in darkness for the remaining period. Water was sprinkled using a spray bottle at 8-hour intervals to maintain adequate moisture without waterlogging. These were left to grow until the first true leaves appeared (10-14 days) (Fig. 1). This was followed by harvesting and washing the microgreens and drying them in a hot air oven at 50- 60 °C until the moisture content was reduced to less than 11%, as required for subsequent nutritional analysis. The dried microgreens were cooled to room temperature and ground into a fine powder using a grinder. Approximately 100 g of fresh microgreens yielded 5 g of dried microgreen powder following oven drying. The prepared powder was packed in LDPE zip-lock bags and stored in a deep freezer until further use and analysis [11].
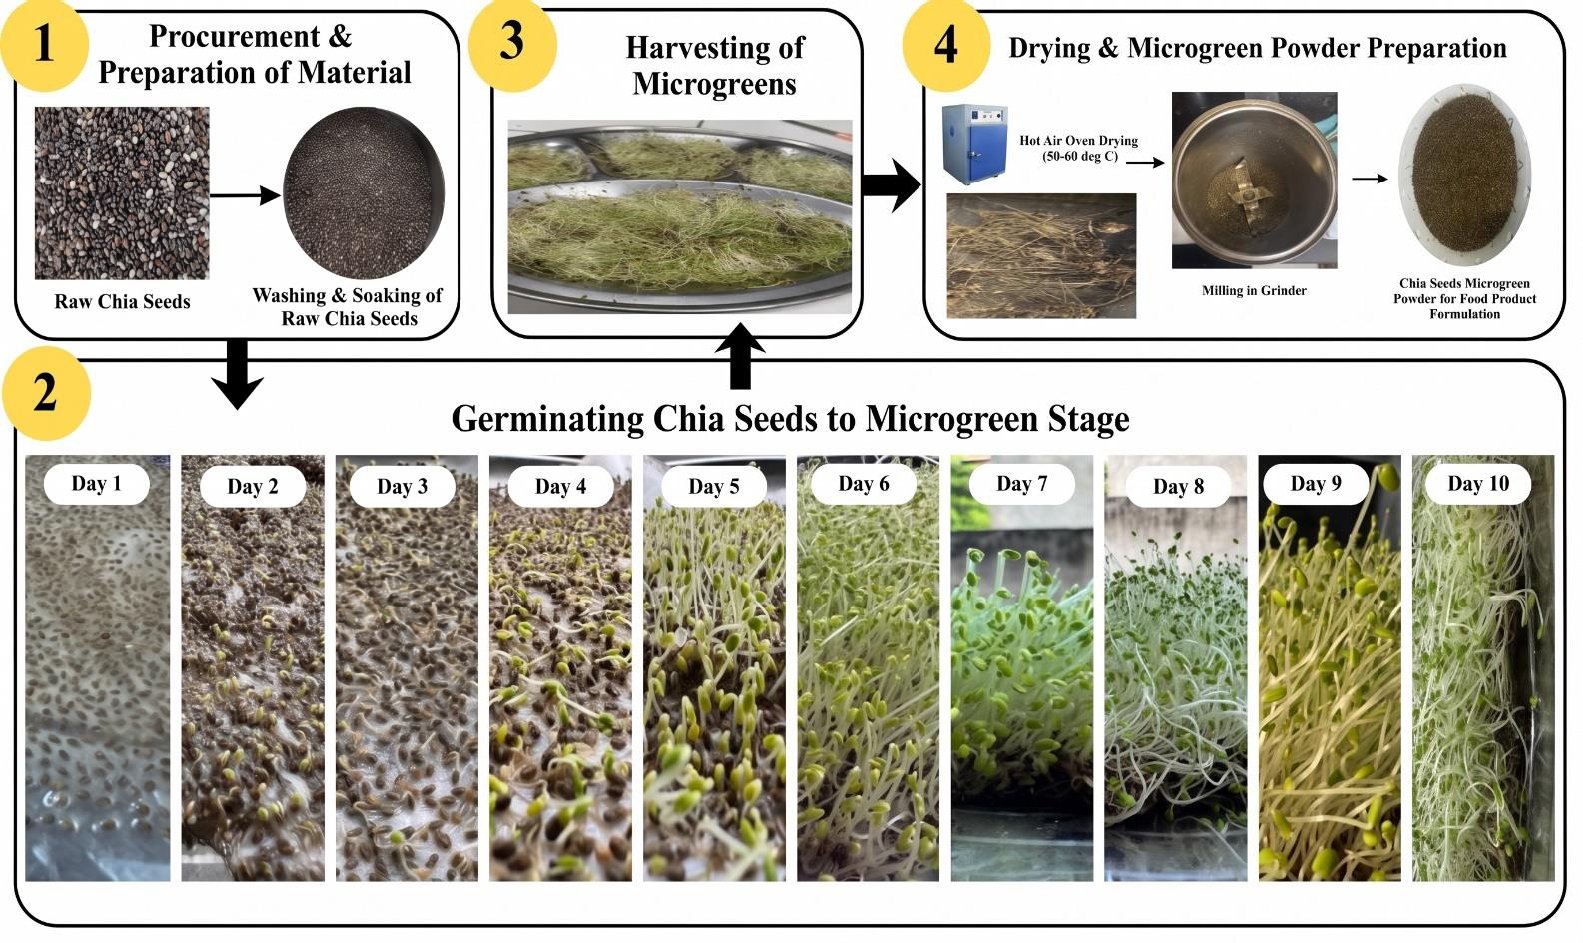
Fig. (1). Sequential stages involved in the cultivation of chia seeds (Salvia hispanica L.) microgreen powder.
2.3. Formulation and Preparation of Chia Microgreen Chapatti
The base ingredient was whole wheat flour, and chia microgreen powder was added in six amounts of 9%, 25%, 31%, 39%, 47%, and 67% chia microgreen powder, and a control (0% microgreen). The formulations corresponded to 2 g powder/23 g flour (9%), 5 g/20 g (25%), 6 g/19 g (31%), 7 g/18 g (39%), 8 g/17 g (47%), and 10 g/15 g (67%), while the control consisted of 25 g whole wheat flour (Table 1). The dry components were thoroughly mixed so that the microgreen powder was evenly distributed. After adding enough water, the material was kneaded into a soft, uniform dough. The dough was allowed to rest for 10-15 min to allow the hydration of the flour particles, improve the consistency, and improve handling properties, and then cut into equal portions and rolled into circles. The chapattis were cooked on a griddle that had been heated to the maximum temperature until both sides of the chapatti were cooked and brown spots formed (Fig. 2).
Table 1. Different compositions of chia seed-based microgreen chapatti.
| Sample | % of Chia Seeds Microgreens Used | Ingredients | Amount (g) |
| S1 | 9% | Chia microgreen powder Whole wheat flour | 2 23 |
| S2 | 25% | Chia microgreen powder Whole wheat flour | 5 20 |
| S3 | 31% | Chia microgreen powder Whole wheat flour | 6 19 |
| S4 | 39% | Chia microgreen powder Whole wheat flour | 7 18 |
| S5 | 47% | Chia microgreen powder Whole wheat flour | 8 17 |
| S6 | 67% | Chia microgreen powder Whole wheat flour | 10 15 |
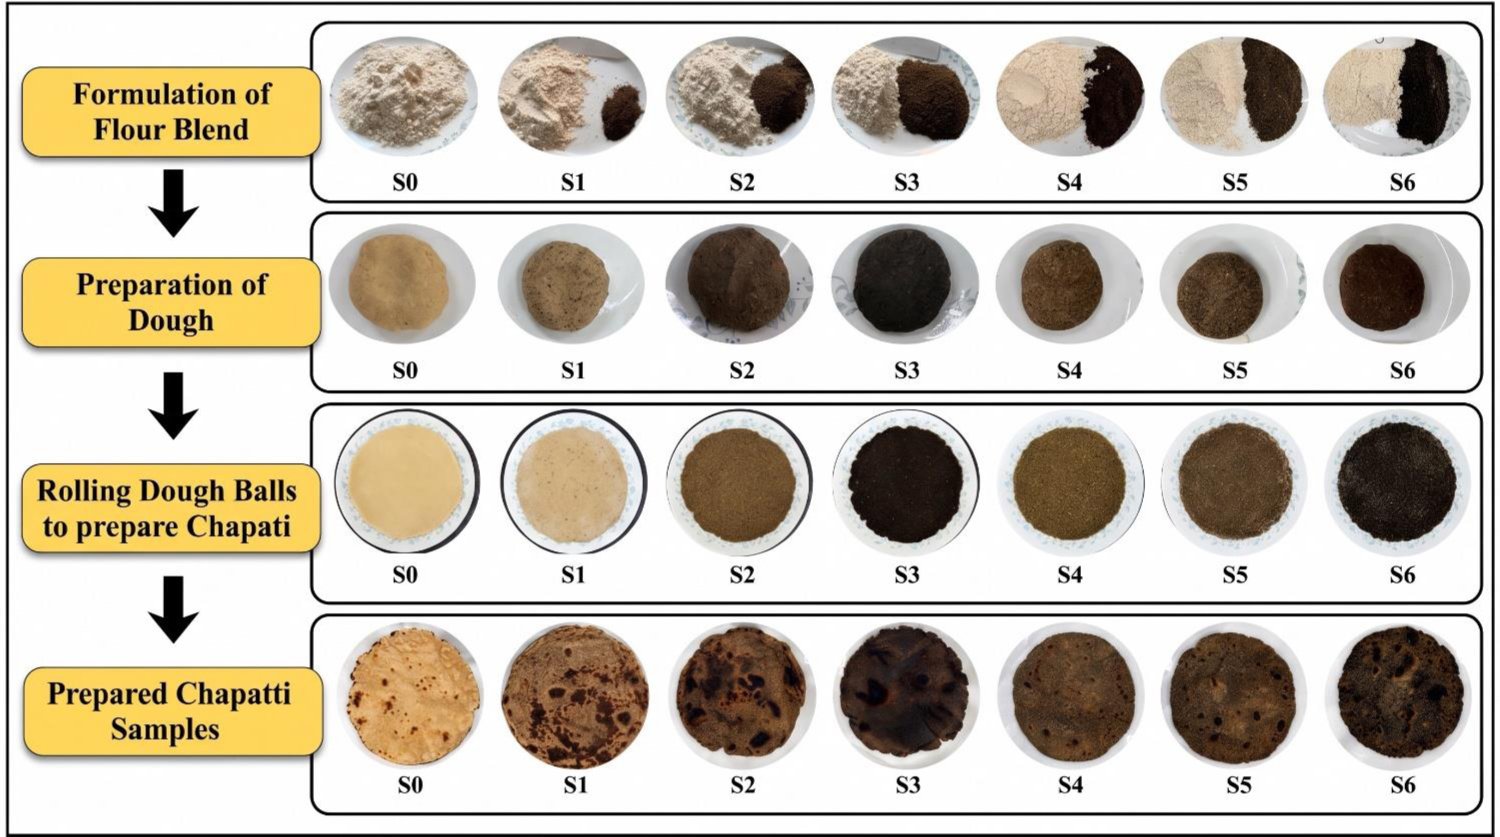
Fig. (2). Sequential steps involved in the development of chia (Salvia hispanica L.) microgreen-fortified chapatti. (S0-Control, S1-S6 refer to Sample 1- Sample 6: Composition as given in Table 1).
2.4. Experimental Replication
The study was conducted using independent experimental batches at each relevant stage. Chia microgreens were cultivated in 10 independent batches (as each batch produced nearly 5 g of microgreen powder), and the chapatti formulations were prepared independently in 7 batches. The control and selected S3 formulation were subjected to proximate, mineral, vitamin, bioactive compound, and anti-nutritional analyses using independent experimental samples. Analytical determinations were performed in triplicate technical measurements for each independent sample.
2.5. Sensory Evaluation
Sensory evaluation was conducted on a 9-point hedonic scale (1: dislike extremely, 9: like extremely), with a panel of 45 judges comprising trained and semi-trained panelists [14] who assessed all six chapatti formulations. Aroma, taste, appearance, texture, color, and overall acceptability were evaluated. Samples were coded and randomly given to prevent bias, and all formulas had similar processing and cooking conditions. The formulation with the highest overall acceptance was chosen for nutrition analysis.
2.6. Nutritional Analysis
The ideal formulation and control sample were evaluated for their approximate composition, vitamins, minerals, and bioactive substances. All values are expressed as per 100 g of dry weight of sample.
2.7. Proximate Composition
Protein was determined by the Kjeldahl method: a known weight of sample was digested with concentrated sulfuric acid in the presence of potassium sulfate and copper sulfate catalysts until the digest cleared, converting organic nitrogen to ammonium sulfate; sodium hydroxide was then added to liberate ammonia, which was distilled into a known volume of standard acid and quantified by back-titration. Nitrogen was calculated as N (%) = [(A − B) × 0.0014 × volume of digest] ÷ (aliquot taken × 5) × 100, where A and B are sample and blank titres, and crude protein was obtained as N × 6.25 [15]. Fat was estimated by Soxhlet extraction using hexane as solvent; the ground sample was extracted over repeated reflux cycles, anhydrous sodium sulfate was used to dry the extract, the solvent was recovered on a rotary evaporator, and the residual fat was cooled in a desiccator and weighed (fat residue = final weight − weighing paper weight) [16]. Total carbohydrates were determined by the Anthrone colorimetric method: the sample was hydrolysed under acid conditions to simple sugars, dehydrated with concentrated sulfuric acid to furfural and hydroxymethylfurfural derivatives, and reacted with freshly prepared anthrone reagent to give a green complex read at 620 nm against a reagent blank, with carbohydrate (mg/g) calculated as absorbance × standard factor [17]. Energy was measured by bomb calorimetry; a dried, weighed sample was combusted in a chamber filled with oxygen under pressure by electrical ignition, and the recorded heat release converted to kcal/100 g using the calibration factor [18]. Fiber was determined by acid–alkali digestion, in which the defatted sample was boiled with dilute acid, filtered and washed, the residue boiled with alkali, filtered, dried and weighed, then ashed and reweighed; fiber (%) = (weight before ashing − weight after ashing) ÷ sample weight × 100 [19].
2.8. Minerals
For iron, the sample was ashed and dissolved in acid, an aliquot was treated with the chromogenic reagent, and color was allowed to develop before absorbance was read at 248.3 nm against standard solutions, with iron (mg/100 g) = absorbance × standard factor [20]. Zinc was determined after acid digestion, filtration and dilution; reagent was added for complex formation and absorbance was read at 213.9 nm against a standard curve, with zinc (mg/100 g) = sample reading × factor [20]. Phosphorus was determined by the ammonium molybdate method, in which phosphorus reacts under acidic conditions to form a phosphomolybdate complex giving a blue coloration; sample ash was dissolved in acid, reagent added and incubated, and absorbance read at 420 nm against standards [21]. Calcium and magnesium were determined by inductively coupled plasma–mass spectrometry (ICP–MS); samples were digested with HNO₃ and H₂O₂, diluted to a known volume and analyzed against calibration standards [22]. Magnesium and selenium were estimated following PBTI/SOP/90:TP-58 by ICP–MS, using microwave-assisted acid digestion with concentrated nitric acid, filtration and dilution to a known volume, ionisation in the plasma and quantification by mass-to-charge ratio against element-specific calibration standards; concentrations were computed as (instrument concentration × final digest volume × dilution factor ÷ sample weight) × 100 [22].
2.9. Vitamins
Vitamin A was estimated spectrophotometrically: the sample was extracted with an organic solvent, an aliquot treated with reagent for color development and incubated, and absorbance read at 325 nm against a standard calibration curve [23]. Vitamin C was determined by the DCPIP (2,6-dichlorophenolindophenol) dye-reduction method, in which a fresh extract was treated with the dye, shaken, and read at 520 nm against a standard curve [24]. Vitamin D was extracted with an organic solvent system, purified, reacted with methanol for complex formation, incubated, and read at 265 nm against standards. Folate was determined by ⟨HPLC / spectrophotometry – the single method actually used⟩ after extraction from the sample using folic acid standards and buffer solutions, and quantified from a calibration curve [25].
2.10. Bioactive Compounds and Anti-Nutrients
Total polyphenols were measured by the Folin–Ciocalteu method; extract was mixed with reagent and sodium carbonate solution, incubated, and read at 765 nm, with results expressed as mg gallic acid equivalents per 100 g [26]. Antioxidant activity was determined by the DPPH radical scavenging assay, with DPPH added to the sample extract, incubated in the dark, and absorbance recorded at 517 nm; activity was calculated as [(Control − Sample) ÷ Control] × 100 [27]. The assay conditions, including extract concentration, solvent, reaction time, temperature, and wavelength, were maintained consistently for the control and fortified samples. The antioxidant activity was therefore compared on the basis of the same sample concentration. Oxalate was determined by the AOAC 941.15 titrimetric method: oxalate was extracted with dilute acid under heating, precipitated as calcium oxalate with calcium chloride solution, dissolved in warm sulfuric acid, and titrated against standardised potassium permanganate to a light pink endpoint persisting for approximately 30 s, with oxalate (mg/100 g) = (volume of KMnO₄ × factor/normality × 45 × 100) ÷ sample weight, where 45 is the equivalent weight of the oxalate ion [28]. Tannins were estimated spectrophotometrically: tannins react with Folin–Denis’s reagent in alkaline medium to form a blue complex, absorbance was measured at 700 nm, and concentration was read from a tannic acid standard curve.
The sensory scores were presented in the form of the mean panel ratings [29], and the most acceptable formulation was chosen to be nutritionally compared to the control.
2.11. Statistical Analysis
Sensory evaluation data for the six chapatti formulations were subjected to one-way analysis of variance (ANOVA) to determine significant differences among the formulations. Duncan’s Multiple Range Test (DMRT) was subsequently applied for post-hoc comparison of means. Based on sensory acceptability, most acceptable formulation was selected for further nutritional and biochemical characterization. The control chapatti and most acceptable formulation were compared using a t-test for proximate composition, mineral composition, vitamin content, bioactive compounds, and anti-nutritional factors. A p-value of < 0.05 was considered statistically significant. Statistical analyses were performed using IBM SPSS statistics version 30.
3. RESULTS
3.1. Cultivation of Chia Microgreens and Powder Preparation
Chia seeds germinated successfully under the darkened, moist conditions described in the methodology, with sprouting initiated within 24-48 hours of sowing. The seedlings were harvested at the first-true-leaf stage after 10-14 days of growth, oven-dried at 50-60 °C, crushed into a fine powder, and stored under refrigeration till use. The dried powder was incorporated into all subsequent formulations.
3.2. Sensory Evaluation of Chia Microgreen–Enriched Chapatti
Six enriched formulations and a control (25 g whole wheat flour) were assessed by trained and semi-trained panelists on a nine-point hedonic scale. Mean scores for all attributes are presented in Table 2.
Table 2. Mean sensory scores of chia microgreen–enriched chapatti formulations.
| Attributes | S1 2 g (2:23) | S2 5 g (5:20) | S3 6 g (6:19) | S4 7 g (7:18) | S5 8 g (8:17) | S6 10 g (10:15) |
| Taste | 7.2 | 6.0 | 7.25 | 7.1 | 7.0 | 4.0 |
| Appearance | 7.3 | 6.5 | 7.33 | 7.1 | 6.9 | 5.0 |
| Aroma | 7.3 | 6.3 | 7.25 | 7.1 | 7.0 | 5.0 |
| Color | 7.5 | 6.1 | 7.62 | 7.5 | 6.9 | 4.8 |
| Texture | 7.4 | 6.0 | 7.35 | 7.6 | 6.6 | 4.5 |
| Overall acceptability | 7.34 | 6.18 | 7.36 | 7.28 | 6.88 | 4.66 |
The S3 formulation (6 g microgreen powder: 19 g flour, i.e., 31% incorporation) recorded the highest overall acceptability score of 7.36, followed by the 2 g formulation (7.34) and the 7 g formulation (7.28); the 10 g formulation scored lowest (4.66). Across the enriched samples, the rank order of overall acceptability was 6 g > 2 g > 7 g > 8 g > 5 g > 10 g. The highest single-attribute scores were recorded for color (7.62) and texture (7.6) at the 6 g and 7 g levels, respectively, while the 10 g formulation received the lowest scores on all attributes (taste 4.0, color 4.8, texture 4.5, aroma 5.0, appearance 5.0) (Fig. 3). A one-way ANOVA was conducted to determine the significant differences between the sensory scores of different chapatti formulations. The results showed that there were significant differences (p < 0.05) among the formulations. Post-hoc analysis using Duncan’s multiple range test revealed that sample S3 scored significantly higher (p < 0.05) in overall acceptability compared to other variations.
The 6 g formulation was therefore selected for detailed biochemical analysis.
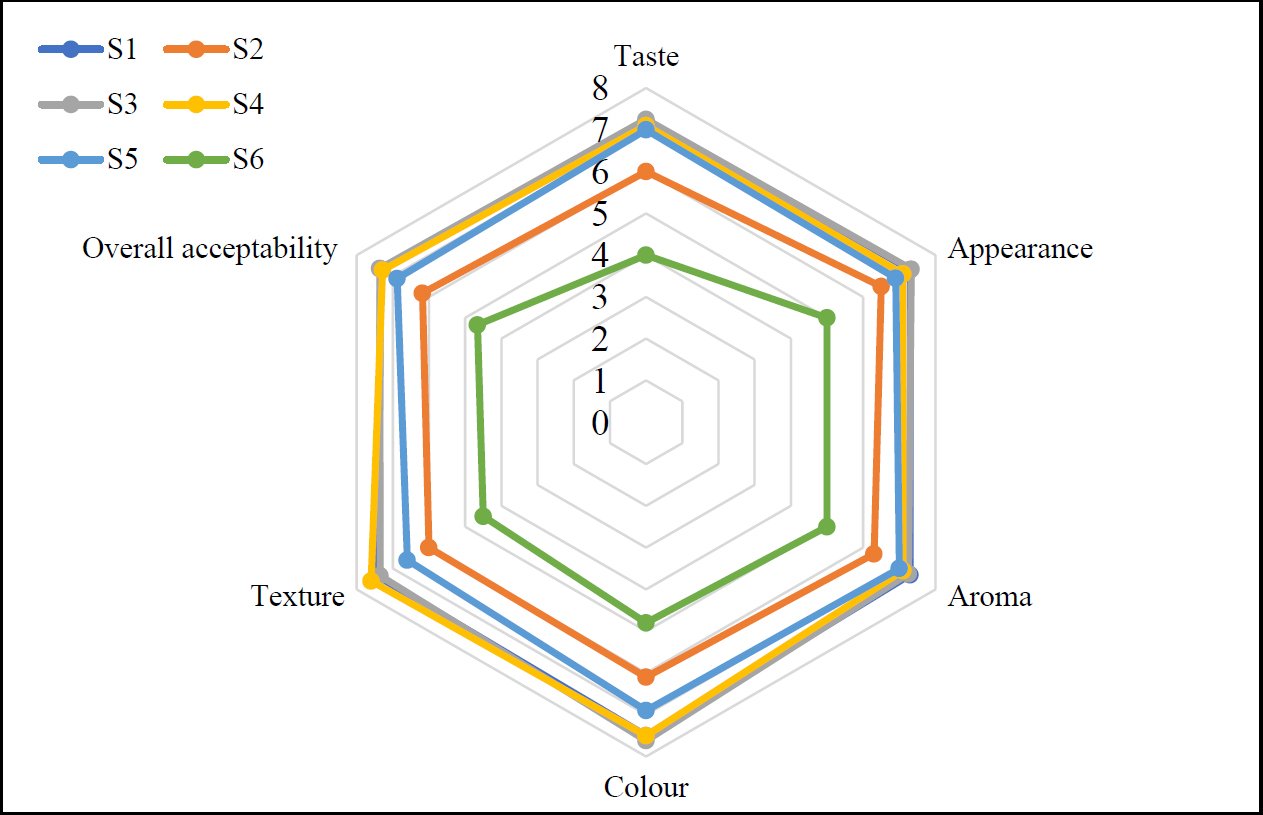
Fig. (3). Representation of Sensory scores of chia microgreen-enriched chapatti formulations.
3.3. Proximate Composition
Proximate values for the selected formulation and the control are demonstrated in Table 3. Statistical analysis showed significant differences (p < 0.05) in the proximate composition parameters between control and microgreen chapatti samples as determined by t-test.
Table 3. Proximate composition of control and 31% chia microgreen-enriched chapatti (per 100 g).
| Parameters | Control | Microgreen Chapatti |
| Protein (g) | 6.0 | 19.90 |
| Fat (g) | 3.6 | 6.27 |
| Carbohydrate (g) | 42 | 34 |
| Dietary fiber (g) | 3.2 | 4 |
| Energy (kcal) | 229 | 304 |
Protein content increased nearly 3.3-fold as compared to the control sample. Fat, dietary fiber, and energy were also higher in the enriched chapatti, whereas carbohydrate content was comparatively lower.
3.4. Mineral Composition
Mineral concentrations for both samples are presented in Table 4. t- test showed significant differences (p < 0.05) in the mineral composition of all parameters between control and microgreen chapatti samples.
Table 4. Mineral composition of control and 31% chia microgreen-enriched chapatti (per 100 g).
| Parameters | Control | Microgreen Chapatti |
| Iron (mg) | 1.9 | 95.8 |
| Calcium (mg) | 33 | 905 |
| Phosphorus (mg) | 110.28 | 981 |
| Zinc (mg) | 0.16 | 9.1 |
| Magnesium (mg) | 61.5 | 581 |
| Selenium (mg) | 0.6 | 0.05 |
All minerals except selenium were present at substantially higher concentrations in the enriched chapatti; iron increased ~50-fold and calcium ~27-fold, while selenium declined from 0.6 to 0.05 mg/100 g.
3.5. Vitamin Content
Vitamin concentrations for both samples are demonstrated in Table 5. Statistical analysis using the t- test indicated significant differences (p < 0.05) in the vitamin content parameters between control and microgreen chapatti.
Table 5. Vitamin content of control and 31% chia microgreen–enriched chapatti (per 100 g).
| Parameter | Control | Microgreen Chapatti |
| Vitamin A (mg) | 0.60 | 1.79 |
| Vitamin C (mg) | not detected | 5.54 |
| Vitamin D (mg) | not detected | 0.07 |
| Vitamin D (I.U.) | not detected | 2800 |
| Folate (µg) | 10 | 56 |
Vitamin A was ~3-fold higher in the enriched chapatti, and folate increased from 10 to 56 µg/100 g. Vit C (5.54 mg/100 g) and vit D (0.07 mg/100 g) were detected only in the enriched product.
3.6. Bioactive Compounds and Anti-Nutrients
Total polyphenolic content, antioxidant activity, and anti-nutrient levels are presented in Table 6. Statistical analysis showed significant differences (p < 0.05) in the bio-active compounds and anti- nutrient parameters between control and microgreen chapatti samples as determined by t-test.
Table 6. Bioactive compounds and anti-nutrients in control and 31% chia microgreen-enriched chapatti (per 100 g).
| Parameter | Control | Microgreen Chapatti |
| Total polyphenols (mg GAE/g) | 2.6 | 14.93 |
| Antioxidant activity (% DPPH inhibition) | 60 | 73.63 |
| Oxalate (mg) | 30.6 | 3.9 |
| Tannins (mg) | 0.856 | 61.68 |
Total polyphenols increased from 2.6 to 14.93 mg GAE/g and antioxidant activity from 60% to 73.63%. Oxalate reduced from 30.6 to 3.9 mg/100 g, but tannin increased from 0.856 to 61.68.
4. DISCUSSION
This study showed that chia microgreen powder can be incorporated into whole wheat chapatti at a level that maximizes sensory acceptability while markedly improving nutrient density. The 6 g (31%) formulation was the most acceptable by all attributes, and the final product contained significantly higher amounts of protein, minerals, vitamins, fiber, and polyphenols than the unfortified control, in line with the reported ability of microgreens to accumulate nutrients at higher levels than those in mature plants [4, 6].
4.1. Sensory Acceptability
Acceptability of the fortified chapatti decreased monotonically with increasing microgreen powder (6 g), and color, taste, and texture ratings decreased most dramatically at 10 g (overall score 4.66). This trend resembles previous fortification studies in flatbread matrices: unleavened flatbreads fortified with processed cabbage powder were most acceptable at 5% fortification (approximately 7.6 on a scale of nine) and were least acceptable at levels above 7.5 [30], and tortillas fortified with oyster mushroom powder were best accepted at 5% fortification (approximately 7.6 on a nine-point scale) and were least acceptable at higher levels [31]. Baked goods had the same ceiling: 10 percent spinach microgreen powder was best for biscuits [12], while muffins could only contain lyophilized basil, fenugreek, and wheatgrass microgreen juice powders [32], whereas wheatgrass-enriched steamed bread was optimally acceptable at the levels at which it was experimented with [33]. These optima being very similar in some of the most diverse cereal matrices imply that the constraining element is not technical capability but sensory tolerance, probably due to increasing disruption of the gluten-starch network, darker green discoloration, and more bitter and astringent notes as chlorophyll and phenolic compounds build up [33]. The 31 % inclusion obtained here, much greater than the 37.5 percent optimum of powder fortification, is noteworthy, and could be due to the masking power of the whole wheat flavour of chapatti and the bland, vegetal nature of young chia tissue; consumer research nonetheless confirms that preference towards products containing microgreens is largely flavour-driven and generally likeable [34].
4.2. Proximate Composition
The approximately threefold increase in protein (6.0 to 19.90 g/100 g) can be described by two intersecting factors: the high protein content of the ingredient, where chia microgreen powder has a protein content of 34.7% and an amino acid score of 80 [11], and the upregulation of protein synthesis during germination [35]. The simultaneous reduction of carbohydrate (42 to 34 g/100 g) may be mechanistically consistent, with germination activating amylolytic enzyme hydrolysis of starch to soluble sugars to power seedling growth [36], which also interferes with the structure of starch grains in cereals [37]. These increases in fat (3.6-6.27 g/100 g), fiber (3.2-4 g/100 g), and energy (229-304 kcal) indicate the lipid- and fiber-rich seed levels of chia and the established change to more digestible and higher-quality macronutrient fractions during sprouting [35]. Similar enhancements were noted with wheat flatbreads fortified with germinated legumes and dehydrated greens, which reportedly contained more protein, fiber, iron, and calcium than their unfortified controls [38].
4.3. Mineral Composition
The mineral enrichments, iron (~50-fold), calcium (~27-fold), and phosphorus, zinc, and magnesium (each several-fold), are in line with mineral enrichment of chia microgreens [11] as well as the biochemical outcomes of germination. Germination activates endogenous phytase and other hydrolases that break down phytate, the major mineral-sequestering antinutrient in seeds, that could make minerals (calcium, iron, zinc, phosphorus) more bioavailable [35, 36]; degradation of phytate and tannins during germination has been repeatedly demonstrated to enhance mineral bioavailability in cereals [39].
4.4. Vitamin Content
Vitamin A almost tripled (0.60 to 1.79 mg/100 g), vitamin C was found where none existed before (5.54 mg/100 g), and folate rose by 10 to 56 µg/100 g. The increase in vitamin C is in line with the ascorbic acid biosynthesis that was stimulated by germination, as reported in other microgreen-enriched foods like buckwheat microgreen snack bars, where vitamin C increased to 1.25 to 6.25 mg/100 g [13]. In the case of the heat-labile vitamins, the values measured can be considered conservative: baking of fresh plant material into bread destroys carotenoids and chlorophyll and diminishes flavonoids [40], and loss of folic acid of 21.9-32.1% during commercial bread baking has been reported [41], and spinach and Swiss chard fortified bread formulations also exhibited reduced folate post-bake [42]. However, bread loaves still contain about 87 percent of added folic acid [25], folate bioaccessibility in wheat breads remains 44-96 percent across formulations [43], and even breads fortified with plant material can significantly increase the consumption of health-promoting secondary metabolites by consumers [40]. The folate content of the baked chapatti thus is likely to be underestimated by the folate contribution of the ingredient used, and a significant proportion of the folate delivered is likely to pass on to consumption.
4.5. Bioactive Compounds and Anti-Nutrients
Total polyphenols increased from 2.6 to 14.93 mg GAE/g and DPPH antioxidant activity from 60% to 73.63%. Germination activates phenylalanine ammonia-lyase and associated biosynthetic enzymes to increase the phenolic content and antioxidant activity of seeds and grains [35, 44]. In wheat, germination increases the solubility of bound phenolics and in vitro antioxidant and anti-inflammatory activity [37], and sprouted oat powder has approximately three times greater antioxidant capacity than non-germinated grain [45]. The strong decrease of oxalate (30.6 to 3.9 mg/100 g) coincides with the fact that germination decreases phytate and oxalates in various seeds [46]. The tannin (0.856 to 61.68 mg/100 g) increase; in turn, this does not follow the usual germination trend: tannin decreases are usually observed in germinated millets, maize, and cowpeas [46], but tannin increases are also reported in germinated buckwheat [39]. Such species- and matrix-dependence implies that tannin response in chia microgreens needs to be directly monitored, especially since tannins have the potential to complex minerals and suppress their absorption [39, 47].
PRACTICAL IMPLICATIONS AND FUTURE RESEARCH
The fortified chapatti is an example of food-to-food fortification, fortification of commonly eaten foods with micronutrient-rich plant ingredients, a new approach that can help eliminate several micronutrient deficiencies simultaneously with minimal alteration of consumer diets [48]. Given that billions suffer from micronutrient deficiency [1, 2] and supplementation interventions have failed to meet their goals numerous times [3], a daily-eaten staple food, like chapatti, is an attractive delivery vehicle; the success of such interventions, however, hinges on consistent staple intake and on the quality of ingredients consumed [48].
Future research needs to focus on (i) bioaccessibility/bioavailability evaluation of the final chapatti [43, 49]; (ii) optimization of processing conditions to minimize heat-related loss of carotenoids, folates, and antioxidants during baking [33, 40]; (iii) agronomic biofortification of the chia microgreens themselves to further increase zinc and iron [50]; (iv) storage-stability and shelf-life research of the powder and the product; (v) validation using larger and more representative consumer panels [34]; and (vi) supply-chain and cost studies of the microgreen fortificant [48].
CONCLUSION
This paper has shown that chia (Salvia hispanica L.) seed microgreens can be grown, dried, and ground into a stable functional powder and that this product can be added to whole wheat chapatti at 31 percent (6 g microgreen powder per 19 g flour) without affecting consumer acceptability. The highest sensory scores were measured using the chosen formulation, which had an average acceptability of 7.36 out of 9, and a formulation with a score greater than 6 g had a decline in color acceptability, taste, and texture rating. The most notable fact about this work is that the fortificant, i.e., the addition of only 6 g of chia microgreen powder per 25-g serving of the selected S3 chapatti contributed approximately 30 percent or more of the ICMR- NIN (2020) recommended dietary intake of the key micronutrients, including magnesium, Vitamin A, and iron depending on the adult reference group meaning that even a small, sensorially acceptable addition could have a significant dietary effect. Moreover, the level of incorporation of 31% is higher than the reported incorporation levels in similar studies that are usually between 3-10 percent. The current formulation therefore illustrates that chapatti can be substantially enriched with microgreens compared with the cereal-based products that have been reported before, without compromising on consumer acceptability.
Fortified chapatti outperformed the control nutritionally: Protein increased from 6 to 19.90 g/100 g, Mg from 61.5 to 581 mg/100 g, Ca from 33 to 905 mg/100 g, Fe from 1.9 to 95.8 mg/100 g, dietary fiber from 3.2 to 4 g/100 g, Zn from 0.16 to 9.1 mg/100 g, Ph from 110.28 to 981 mg/100 g, Folate from 10 to 56 µg/100 g, Vitamin A from 0.60 to 1.79 mg/ 100 g and vit C (5.54 mg/100 g). These results are in agreement with the reported ability of microgreens to accumulate vitamins, minerals, and bioactive phytochemicals above the levels of mature plants, and with the proven effects of germination, storage compound mobilization, antinutrient reduction, and phenolic biosynthesis stimulation on the nutritional quality of cereal- and seed-based matrices.
This research has practical implications because it is in the context of human health: micronutrient deficiencies, or hidden hunger, are a persistent problem in billions of individuals across the globe, and fortification of staple foods has been identified as one of the potential candidates for scalable and sustainable dietary interventions. The present study offers a candidate application that warrants the evaluation of cost of production analysis and large-scale manufacturing trial. The findings are therefore best read as proof of concept for the formulation itself.
Together, the findings support chia microgreens as a viable natural fortification for staple cereal foods and offer a scalable model for fortifying other flatbreads and convenience cereal products eaten in South Asia.
LIST OF ABBREVIATIONS
ANOVA | = | Analysis of Variance |
DPPH | = | 2,2-Diphenyl-1-picrylhydrazyl |
DCPIP | 2,6-Dichlorophenolindophenol | |
GAE | = | Gallic Acid Equivalents |
HPLC | = | High-Performance Liquid Chromatography |
ICP-MS | = | Inductively Coupled Plasma–Mass Spectrometry |
SOP | = | Standard Operating Procedure |
AUTHORS’ CONTRIBUTIONS
S.K.: Methodology, Data curation, Conceptualization, Investigation, and Writing – original draft. A.K.S.: Methodology, Data analysis and Writing – review and editing. V.B.: Methodology, Conceptualization, Validation, Supervision, and Writing – review and editing. R.P.: Methodology, Conceptualization, Validation, Supervision, and Writing – review and editing. All authors read and approved of the final manuscript.
ETHICAL APPROVAL & INFORMED CONSENT
No human intervention was involved in this study; therefore, formal ethical approval was not required. All respondents, however, gave their informed consent before taking part in the sensory assessment. The respondents voluntarily took part after being made aware of the nature and goal of the sensory evaluation.
AVAILABILITY OF DATA AND MATERIALS
Data is available from the corresponding author upon reasonable request.
FUNDING
This research received no specific funding.
CONFLICT OF INTEREST
The authors declare that they have no competing interests.
ACKNOWLEDGEMENTS
The institution’s cooperation in providing the infrastructure and laboratory equipment required to conduct this investigation is acknowledged by the authors. The authors would like to express their gratitude to the laboratory personnel for their collaboration, support, and technical help during the experiment. We also express our gratitude to everyone who helped us finish the study successfully.
DECLARATION OF AI
No AI tools were employed in the creation of this work.
REFERENCES
[1] Straeten DVD, Bhullar NK, Steur HD, Gruissem W, MacKenzie DJ, Pfeiffer W, Qaim M, Slamet‐Loedin IH, Strobbe S, Tohmé J, Trijatmiko KR, Vanderschuren H, Montagu MV, Zhang C, Bouis HE. Multiplying the efficiency and impact of biofortification through metabolic engineering. Nat Commun 2020; 11:5203.
https://doi.org/10.1038/s41467-020-19020-4
[2] Welch RM, Graham RD. Breeding for micronutrients in staple food crops from a human nutrition perspective. J Exp Bot 2004; 55:353–64.
https://doi.org/10.1093/jxb/erh064
[3] Garg M, Sharma N, Sharma S, Kapoor P, Kumar A, Chunduri V, Arora P. Biofortified Crops Generated by Breeding, Agronomy, and Transgenic Approaches Are Improving Lives of Millions of People around the World. Front Nutr 2018; 5:12.
https://doi.org/10.3389/fnut.2018.00012
[4] Bhaswant M, Shanmugam DK, Miyazawa T, Miyazawa T, Abe C, Miyazawa T, Miyazawa T. Microgreens: A Comprehensive Review of Bioactive Molecules and Health Benefits. Molecules 2023; 28:867.
https://doi.org/10.3390/molecules28020867
[5] Gupta A, Sharma T, Singh SP, Bhardwaj A, Srivastava D, Kumar R. Prospects of microgreens as budding living functional food: Breeding and biofortification through OMICS and other approaches for nutritional security. Front Genet 2023; 14:1053810.
https://doi.org/10.3389/fgene.2023.1053810
[6] Xiao Z, Lester GE, Luo Y, Wang Q. Assessment of Vitamin and Carotenoid Concentrations of Emerging Food Products: Edible Microgreens. J Agric Food Chem 2012; 60:7644–51.
https://doi.org/10.1021/jf300459b
[7] Rawat K, Jain M, Pahuja AN. Microgreens: A Review on Bioactive Compounds, Sensory Acceptance and Utilisation in Functional Food Development. Def Life Sci J 2024; 9:224–32.
https://doi.org/10.14429/dlsj.9.19203
[8] Lone JK, Pandey R, Gayacharan C. Microgreens on the rise: Expanding our horizons from farm to fork. Heliyon 2024;10.
https://doi.org/10.1016/j.heliyon.2024.e25870
[9] Teng J, Liao P, Wang M. The role of emerging micro-scale vegetables in human diet and health benefits—an updated review based on microgreens. Food Funct 2021; 12:1914–32.
https://doi.org/10.1039/d0fo03299a
[10] Gunathilake S, Aluthge S, Farahnaky A, Jafarzadeh S, Majzoobi M. Cereal and pseudocereal microgreens: Emerging functional foods for human health and sustainability. J Cereal Sci 2025; 125:104259.
https://doi.org/10.1016/j.jcs.2025.104259
[11] John SET, Gunathilake S, Aluthge S, Farahnaky A, Majzoobi M. Unlocking the Potential of Chia Microgreen: Physicochemical Properties, Nutritional Profile and Its Application in Noodle Production. Food Bioprocess Technol 2025; 18:5605–20.
https://doi.org/10.1007/s11947-025-03792-y
[12] Rana GK, Mishra SP, Ansari F, Pancheshwar DK, Singh Y. Chemical and Organoleptic Study of Micro Green Based Functional Biscuits. Arch Curr Res Int 2025; 25:469–77.
https://doi.org/10.9734/acri/2025/v25i81431
[13] V, Anand D, Shah DY, Anand T. Formulation and characterization of whole grain-based snack bar enriched with buckwheat (Fagopyrum esculentum) microgreens. Int J Home Sci 2026; 12:157–67.
https://doi.org/10.22271/23957476.2026.v12.i2b.2114
[14] Lim J, Wood A, Green BG. Derivation and Evaluation of a Labeled Hedonic Scale. Chem Senses 2009; 34:739–51.
https://doi.org/10.1093/chemse/bjp054
[15] Hussain S, Randhawa MA, Rakha A, Shahid M. Ultrasound-assisted extraction, quantification and characterization of inulin from agave, chicory and Jerusalem artichoke. Sci Rep 2026;16.
https://doi.org/10.1038/s41598-026-43085-8
[16] Siddiqui B, Ahmad A, Yousuf O, Younis K. Exploring the potential of mosambi peel and sago powder in developing edible spoons. Sustain Food Technol 2023; 1:921–9.
https://doi.org/10.1039/d3fb00111c
[17] Yemm EW, Willis AJ. The estimation of carbohydrates in plant extracts by anthrone. Biochem J 1954; 57:508–14.
https://doi.org/10.1042/bj0570508
[18] Hopper Z, Desbrow B, Roberts S, Irwin C. Preparation procedures of food and beverage samples for oxygen bomb calorimetry: A scoping review and reporting checklist. J Food Drug Anal 2023; 31:232–43.
https://doi.org/10.38212/2224-6614.3461
[19] Madhu C, Krishna KM, Reddy KR, Lakshmi PJ, Kelari E kumar. Estimation of Crude Fibre Content from Natural Food Stuffs and its Laxative Activity Induced in Rats. Int J Pharma Res Health Sci 2017; 5:1703–6.
https://doi.org/10.21276/ijprhs.2017.03.04
[20] Jorhem L, Afthan G, Cumont G, Dypdahl HP, Gadd KF, Havre GN, Julshamn K, Kåverud K, Lind B, Loimaranta J, Merseburg M, Olsson A, Piepponen S, Sundström B, Uppstad BJ, Waaler T, Winnerstam L. Determination of Metals in Foods by Atomic Absorption Spectrometry after Dry Ashing: NMKL1 Collaborative Study. J AOAC Int 2000; 83:1204–11.
https://doi.org/10.1093/jaoac/83.5.1204
[21] Xiang XL, Luo LL, Dang FM. Research and improvement of determination for phosphorus in food by molybdenum blue spectrophotometry. J Anhui Agric Sci. 2015;43(8):244-245. Available from: https://ahnye.cbpt.cnki.net/portal/journal/portal/client/paper/40a8e36ffe5b8dd96cb72d05fd270758
[22] Orecchio S, Amorello D, Raso M, Barreca S, Lino C, Gaudio FD. Determination of trace elements in gluten-free food for celiac people by ICP-MS. Microchem J 2014; 116:163–72.
https://doi.org/10.1016/j.microc.2014.04.011
[23] Aremu S, Nweze C. Determination of vitamin A content from selected Nigerian fruits using spectrophotometric method. Bangladesh J Sci Ind Res 2017; 52:153–8.
https://doi.org/10.3329/bjsir.v52i2.32940
[24] Yadav A, Jha S, Choudhary G, Ram A, Kumar R, Kumar N, Anuragi H, Garg S, Kumar A, Singh PK, Dwivedi RP, Arunachalam A, Jinger D. Nutritional valorization of Manila tamarind accessions through antioxidant analysis and UHPLC-Q-TOF-MS-based metabolomic profiling. Front Nutr 2025; 12:1646522.
https://doi.org/10.3389/fnut.2025.1646522
[25] Azevedo EP de P, Alves EM dos S, Khan S de S, Silva L dos S, Souza JRB de, Santos BS, Rabello CB-V, Costa AC dos S, Azevedo EP de P, Vasconcelos MA da S. Folic acid retention evaluation in preparations with wheat flour and corn submitted to different cooking methods by HPLC/DAD. PLoS One 2020;15.
https://doi.org/10.1371/journal.pone.0230583
[26] Layal A, Hassan R, Ahmad K, Hamid BS. Chemical composition and biological potentials of Lebanese Cupressus sempervirens L. leaves extracts. J Med Plants Res 2020; 14:292–9.
https://doi.org/10.5897/jmpr2019.6843
[27] Tsai J-C. Antioxidant activities of phenolic components from various plants of Desmodium species. Afr J Pharm Pharmacol 2011; 5:468–76.
https://doi.org/10.5897/ajpp11.059
[28] Keyata EO, Tola YB, Bultosa G, Forsido SF. Optimization of nutritional and sensory qualities of complementary foods prepared from sorghum, soybean, karkade and premix in Benishangul – Gumuz region, Ethiopia. Heliyon 2021;7.
https://doi.org/10.1016/j.heliyon.2021.e07955
[29] Wichchukit S, O’Mahony M. The 9‐point hedonic scale and hedonic ranking in food science: some reappraisals and alternatives. J Sci Food Agric 2014; 95:2167–78.
https://doi.org/10.1002/jsfa.6993
[30] Waseem M, Akhtar S, Qamar M, Saeed W, Ismail T, Esatbeyoglu T. Effect of Thermal and Non-Thermal Processing on Nutritional, Functional, Safety Characteristics and Sensory Quality of White Cabbage Powder. Foods 2022; 11:3802.
https://doi.org/10.3390/foods11233802
[31] Ishak WRW, Ahmad WANW, Bakar NA. Does oyster mushroom (Pleurotus sajorcaju) powder addition improve nutrient composition, sensory acceptability, and glycaemic index (GI) of flatbread (Tortilla)? Kuwait J Sci 2021;48.
https://doi.org/10.48129/kjs.v48i2.9399
[32] Kumar A, Singh N. Embracing nutritional, physical, pasting, textural, sensory and phenolic profile of functional muffins prepared by partial incorporation of lyophilized wheatgrass, fenugreek and basil microgreens juice powder. J Sci Food Agric 2024; 104:4286–95.
https://doi.org/10.1002/jsfa.13314
[33] Bilal M, Du Y, Li D, Yang R, Xie C, Wang P. Assessing the wheatgrass powder as a functional ingredient in steamed bread from the nutritional and techno-functional perspective. Grain Oil Sci Technol 2025; 8:271–7.
https://doi.org/10.1016/j.gaost.2025.07.002
[34] Michell K, Isweiri H, Newman SE, Bunning M, Bellows L, Dinges MM, Grabos LE, Rao S, Foster MT, Heuberger AL, Prenni JE, Thompson HJ, Uchanski M, Weir TL, Johnson SA. Microgreens: Consumer sensory perception and acceptance of an emerging functional food crop. J Food Sci 2020; 85:926–35.
https://doi.org/10.1111/1750-3841.15075
[35] Gunathunga C, Senanayake G, Jayasinghe M, Brennan CS, Truong T, Marapana U, Chandrapala J. Germination effects on nutritional quality: A comprehensive review of selected cereals and pulses changes. J Food Compos Anal 2024; 128:106024.
https://doi.org/10.1016/j.jfca.2024.106024
[36] Nkhata SG, Ayua E, Kamau EH, Shingiro J. Fermentation and germination improve nutritional value of cereals and legumes through activation of endogenous enzymes. Food Sci Nutr 2018; 6:2446–58.
https://doi.org/10.1002/fsn3.846
[37] Tomé I, Martín‐Diana AB, Peñas E, Frı́as J, Rico D, Jiménez-Pulido IJ, Martı́nez-Villaluenga C. Bioprocessed Wheat Ingredients: Characterization, Bioaccessibility of Phenolic Compounds, and Bioactivity During in vitro Digestion. Front Plant Sci 2021; 12:790898.
https://doi.org/10.3389/fpls.2021.790898
[38] Bhavya SN, Prakash J. Nutritional properties of iron fortified flatbreads enriched with greens and legumes. J Food Process Preserv 2021;45.
https://doi.org/10.1111/jfpp.15495
[39] Samtiya M, Aluko RE, Dhewa T. Plant food anti-nutritional factors and their reduction strategies: an overview. Food Prod Process Nutr 2020;2.
https://doi.org/10.1186/s43014-020-0020-5
[40] Klopsch R, Baldermann S, Voß A, Rohn S, Schreiner M, Neugart S. Bread Enriched with Legume Microgreens and Leaves Ontogenetic and Baking-Driven Changes in the Profile of Secondary Plant Metabolites. Front Chem 2018; 6:322.
https://doi.org/10.3389/fchem.2018.00322
[41] Anderson WA, Slaughter D, Laffey C, Lardner C. Reduction of folic acid during baking and implications for mandatory fortification of bread. Int J Food Sci Technol 2010; 45:1104–10.
https://doi.org/10.1111/j.1365-2621.2010.02226.x
[42] Betoret E, Rosell CM. Enrichment of bread with fruits and vegetables: Trends and strategies to increase functionality. Cereal Chem 2019; 97:9–19.
https://doi.org/10.1002/cche.10204
[43] Liu F, Edelmann M, Piironen V, Kariluoto S. 5-Methyltetrahydrofolate Is a Crucial Factor in Determining the Bioaccessibility of Folate in Bread. J Agric Food Chem 2022; 70:13379–90.
https://doi.org/10.1021/acs.jafc.2c03861
[44] Günal‐Köroğlu D, Esatbeyoglu T, Çapanoğlu E. Effect of germination on the phenolic compounds: content, bioavailability, food applications, and health benefits. J Food Meas Charact 2025; 19:8144–64.
https://doi.org/10.1007/s11694-025-03392-6
[45] Aparicio-García N, Martı́nez-Villaluenga C, Frı́as J, Peñas E. Sprouted oat as a potential gluten-free ingredient with enhanced nutritional and bioactive properties. Food Chem 2020; 338:127972.
https://doi.org/10.1016/j.foodchem.2020.127972
[46] Dhliwayo TC, Chopera P, Matsungo TM, Chidewe C, Mukanganyama S, Nyakudya E, Mtambanengwe F, Mapfumo P, Nyanga L. Effect of germination and roasting on the proximate, mineral and anti-nutritional factors in finger millet (Eleucine Coracana), Cowpeas (Vigna Unguiculata) and orange maize (Zea mays). Afr J Food Agric Nutr Dev 2023; 23:24346–62.
https://doi.org/10.18697/ajfand.123.22960
[47] Rousseau S, Kyomugasho C, Celus M, Hendrickx M, Grauwet T. Barriers impairing mineral bioaccessibility and bioavailability in plant-based foods and the perspectives for food processing. Crit Rev Food Sci Nutr 2019; 60:826–43.
https://doi.org/10.1080/10408398.2018.1552243
[48] Kruger J, Taylor JRN, Ferruzzi MG, Debelo H. What is food‐to‐food fortification? A working definition and framework for evaluation of efficiency and implementation of best practices. Compr Rev Food Sci Food Saf 2020; 19:3618–58.
https://doi.org/10.1111/1541-4337.12624
[49] Khoja KK, Buckley A, Aslam MF, Sharp P, Latunde‐Dada GO. In Vitro Bioaccessibility and Bioavailability of Iron from Mature and Microgreen Fenugreek, Rocket and Broccoli. Nutrients 2020; 12:1057.
https://doi.org/10.3390/nu12041057
[50] Gioia FD, Petropoulos SΑ, Ozores-Hampton M, Morgan KT, Rosskopf EN. Zinc and Iron Agronomic Biofortification of Brassicaceae Microgreens. Agronomy 2019; 9:677.
https://doi.org/10.3390/agronomy9110677
Licensed
© 2026 Copyright by the Authors.
Licensed as an open access article using a CC BY 4.0 license.
Article Contents Author Abdulrahman Mawlood Abdulghani1, * , Bilal Omar Akram1 1Department of Communication Technology and Network, Faculty of Computer
Article Contents Author Ananya Mishra1, * 1GIFT Engineering and Management College, GIFT Autonomous, Bhubaneswar, India Article History: Received: 13 June,
Article Contents Author Snehal Bansod1, * 1Department of Oral and Maxillofacial Surgery, Maitri Educational Society, Chhattisgarh, India Article History: Received:
Article Contents Author Shallu Kadiyan1, Anupreet Kaur Sobti1 , Ritu Pradhan1 , Vasudha Bansal1, * 1Department of Foods and Nutrition,
Article Contents Author Hafsah Khan1, * , Ayesha Farooq1 , Muhammad Sohail1 , Palwasha Abrar Hussain1 ,
Article Contents Author Ajay Mahesh Gaur1, * 1University of Colorado Denver, Denver, USA Article History: Received: 30 July, 2026 Revised: