


















Article Contents
Article ID: CM2602112015
Views: 19Omnichannel Fulfilment, Supply Chain Transparency, And Customer Loyalty: A Signalling Perspective
 DOI:
 PDF
⬇ Downloads: 1
1Department of Marketing and Supply Chain Management, Iqra University, Karachi, Pakistan
2Department of Business Administration, Commecs Institute of Business and Emerging Sciences-CIBES, Karachi, Pakistan
Received: 09 June, 2026
Revised: 07 October, 2026
Accepted: 12 October, 2026
Published: 23 October, 2026
ABSTRACT:
Introduction: This study investigates whether customers perceive omnichannel fulfilment experiences as an operational indicator of transparency in the supply chain and whether the perception of greenwashing moderates the relationship between supply chain transparency and loyalty in the sustainable beauty retailing sector. This study also tests the differences in these relationships between Gen Z and Millennial consumers.
Methodology: A quantitative cross-sectional survey method was used to sample 410 Malaysian consumers with previous experience in omnichannel beauty shopping. Partial least squares structural equation modelling (PLS-SEM) was used to examine direct, mediating, moderating, and multi-group relationships.
Results: Delivery service quality was positively related to perceived supply chain transparency in both cohorts, while fulfilment process efficiency was significant for Millennials. Perceived supply chain transparency positively influenced customer loyalty in both samples and acted as a mediator of the linkages between fulfilment dimensions and customer loyalty among Millennials. Perceived greenwashing had a statistically significant negative moderating effect among Gen Z consumers but not among Millennials; this moderating effect was negligible in practice for Gen Z consumers. MGA detected no statistically significant differences between Gen Z and Millennials in the structural relationships. Comparisons involving customer loyalty were interpreted cautiously because compositional invariance was not established for this construct.
Conclusion: This study provides empirical evidence that delivery service quality is positively associated with customers’ perceived supply chain transparency, whereas fulfilment process efficiency is significantly associated only with Millennials. Channel integration and return management efficiency were not significantly associated with perceived supply chain transparency.
Keywords: Omnichannel fulfilment, operational fulfilment, supply chain, perceived transparency, perceived greenwashing, customer loyalty, sustainable beauty industry, signalling theory, PLS-SEM.
1. INTRODUCTION
Omnichannel retailing is now widespread across online and offline retail environments, and it has changed the dynamics of firm-customer relationships in modern retail environments (Febriani et al., 2025; Sharma & Dutta, 2023). The proportion of sustainable beauty brands has increased in recent years, with consumers eager to understand how businesses ensure that their supply chain activities are ethical, environmentally friendly, and transparent (Suphasomboon & Vassanadumrongdee, 2026). However, this transparency is difficult to track because customers rarely have access to sourcing and production details. As a result, there is information asymmetry, which makes it difficult for customers to distinguish between those who genuinely care about sustainability and those who engage in “greenwashing” or make misleading claims (Paramitha et al., 2025). This underscores the significance of understanding how businesses can successfully communicate transparency and foster customer loyalty.
Previous studies have tended to concentrate on transparency in the form of firm disclosure, which includes explicit information sharing, sustainability reporting, and certifications (Fan et al., 2024; Gardner et al., 2019). Although these channels are important, they do not consider an essential aspect of today’s retail context: how customers perceive transparency and supply chain integrity by observing the company’s operational practices (Mollenkopf et al., 2022). In this study, delivery accuracy, order tracking, and omnichannel integration were considered. Simultaneously, the integration of omnichannel blurs the line between pre-purchase and post-purchase because customers make their evaluations during the experience of service delivery, not only prior to its use. However, existing research has failed to conceptualise how operational performance serves as a signal that influences perceptions of transparency and, in turn, customer loyalty.
To address this gap, this study uses signalling theory to investigate whether omnichannel fulfilment signals are linked to customers’ perceptions of supply chain transparency and then to customer loyalty. Transparency has been identified as an important aspect of customer perceptions in previous research, especially through formal disclosure channels such as sustainability reporting, certification, and corporate communication (Sansome et al., 2024). The current study further explores this idea by examining whether the observable fulfilment experiences of customers relate to their perceptions of the transparency of supply chain processes. Transparency was not necessarily equated with the observation of the practices of the upstream supply chain, but rather the perceived transparency, accessibility, and visibility of supply chain information by customers in relation to their fulfilment experiences.
However, these signals may not be equally effective in all situations. Greenwashing is a significant credibility issue in sustainable consumption. The lack of credibility of positive signals can occur when customers suspect that a company is overstating or fabricating environmental information (Suphasomboon & Vassanadumrongdee, 2026). Studies on omnichannel and logistics have identified fulfilment as a multi-dimensional process involving delivery performance, channel integration, fulfilment process efficiency, and returns management. All the above are parts of the fulfilment journey, but customers see and measure them at various stages of the journey. Thus, each dimension is potentially a different measure of a company’s capabilities.
Not every point of fulfilment will be felt the same by customers, depending on their signalling view. For example, delivery reliability suggests that the commitments of the organisation are adhered to regularly, which can help show accountability and eliminate uncertainty around processes. Similarly, the process visibility of channels boosts channel integration, fulfilment efficiency equates to organisational coordination, and returns management underscores continued accountability following the purchase. These observable operational behaviours together give customers indirect cues that can lead to a perception of transparency. Similarly, channel integration and returns management are two aspects that reflect operational ability. In this scenario, omnichannel fulfilment is not a single construct but comprises several dimensions, each considered separately to examine how specific operational signals may contribute to customers’ perceptions of supply chain transparency and, in turn, that they are loyal.
Finally, this study acknowledges that customers do not react to signals in the same way. This study also examined whether the proposed signalling relationships differ between Gen Z and Millennial consumers. Previous studies have demonstrated that digital fluency, distrust of corporate communication, and environmental sustainability concerns differ across generations (Bromideh et al., 2026; Wandhe, 2024). This affects the interpretation, assessment, and behavioural outcomes of the signals.
The major contribution of this study is that it presents empirical evidence regarding the most consistent operational indicator of supply chain transparency for customers in omnichannel beauty retailing. This study does not imply that all dimensions of fulfilment act as transparency signals; instead, it indicates that the effect of delivery service quality is the most consistent operational signal, with other fulfilment dimensions having context-specific or non-significant effects.
2. THEORETICAL FRAMEWORK AND HYPOTHESES DEVELOPMENT
2.1. Signalling Theory in the Context of Omnichannel Retail
In the case of information asymmetries, where information is not equally distributed among all parties, signalling theory provides a simple model to explain how firms signal unobservable information to customers (Macchione Saes et al., 2025). Signalling theory was initially developed to account for the transmission of informative signals in a market with information asymmetry, where signals are observable, costly, and hard to imitate (Osburg et al., 2022). Retail firms use a range of signals, including brand names, prices, and certifications, to reduce uncertainty and influence customer perceptions (Konuk, 2023).
However, signalling has developed in an omnichannel context (Yang et al., 2019). Instead of relying on cues that customers can discover before the purchase, customers compare firms throughout various stages of the search, purchase, fulfilment, and post-purchase processes (Mavlanova et al., 2012). This requires a wider approach to signals, including pre-purchase and static signals, as well as dynamic and experiential signals. Addressing logistics skills, such as order visibility, delivery speed, and channel integration, is important to customers and increasingly comes across as demystification and operational excellence for businesses (Wan, 2022).
From this perspective, the quality of omnichannel fulfilment in this study is considered an operational signal interpretation process. In an uncertain environment, service elements that occur before and during the transaction, such as delivery capacity, order visibility, and smooth channel switching, act as signals that form expectations. Customers receive operational transparency signals during post-purchase fulfilment, such as the efficiency of fulfilment, return policies, and delivery accuracy (Pires et al., 2025). While the literature on service research and omnichannel has highlighted operational and fulfilment-related experiences as key drivers of customer evaluations, most signalling studies have focused on pre-purchase information cues (Moreno-Menéndez et al., 2025).
2.2. Omnichannel Fulfilment Quality as a Strategic Signal
Quality is an important bridge between operational and customer viewpoints in omnichannel fulfilment (Khalid, 2024; Cotarelo et al., 2021). In logistics and operations management, fulfilment is defined as a multi-faceted process that involves delivery service quality, channel integration, fulfilment efficiency, and returns management (Leung, 2025). Although discussed from a company’s perspective, recent studies have highlighted their experiential value and indicated that consumers experience these dimensions (Yumurtacı Hüseyinoğlu et al., 2018).
The dimensions of fulfilment are frequently merged in previous studies, thus hiding the distinct informational value of these dimensions. According to signalling theory, when information is asymmetric, consumers rely on an organisation’s observable signals to make judgements (Roohanifar et al., 2025). Thus, there can be some variation in transmitting information regarding transparency across fulfilment dimensions.
Delivery service quality is measured as the reliability and accuracy of delivery; channel integration is measured as coordination between customer touchpoints; fulfilment process efficiency is measured as the responsiveness and control of the process; and returns management efficiency is measured as the ability to support the customer after purchase (Marchet et al., 2018). These dimensions can be considered separate operational experiences, and customers may assign different meanings to each when evaluating an organisation’s transparency. Modelling them as separate constructs allows for a more specific study of the contribution of specific operational signals to transparency perceptions and loyalty outcomes. This dimensional view is especially relevant to signalling theory, which focuses on the meaning of specific observable signals rather than overall organisational aspects.
The dimensions of fulfilment are defined as operational signals that communicate on the issue of information asymmetry according to signalling theory (Peinkofer & Jin, 2023). For instance, timely and accurate delivery means organisational efficiency and order tracking provide visibility and control. Likewise, the integration of omnichannel is closely tied to the integration and visibility of processes (Avvad et al., 2026). Sustainable beauty customers are concerned with product attributes, sustainable sourcing, production, and delivery.
In this study, omnichannel fulfilment is a multi-dimensional operational construct with service quality in delivery, channel integration, efficiency of the fulfilment process, and efficiency of returns management. In the omnichannel retail scenario, the dimensions are modelled as distinct constructs, each serving as an independent operational signal to assess fulfilment performance and draw conclusions about transparency in the supply chain for customers.
Most importantly, the quality of fulfilment can be viewed as a measure of service quality and a signalling mechanism that can affect customers’ views of the firm’s operations (Avvad et al., 2026). A positive fulfilment quality experience can help make the supply chain more visible and accessible to customers, providing them with operational cues that the organisation may be more transparent (Nawaz & Wagner, 2025). This inference process is crucial when there is no direct evidence of supply chain practices.
These operational dimensions do not necessarily reflect sourcing practices, labour conditions, or environmental performance but rather offer tangible signals that are visible and demonstrate openness and accountability to customers. The quality of delivery service reflects that firms can consistently meet their promises and convey operational accountability. Channel integration allows customers to receive the same information throughout the process and improves their perception of the visibility of the process. Fulfilment process efficiency is a measure of organisational control and coordination and can be seen as an indication of clear internal processes by some customers. Likewise, effective returns management reflects that companies are prepared to take responsibility after products are acquired by offering tangible and easy-to-find recovery options for customers. Supply chain visibility is not directly reported by customers but is reflected in observable operational behaviours that diminish uncertainty about the reliability and openness of an organisation.
Thus, we propose the following hypothesis:
H1a: Delivery service quality positively influences perceived supply chain transparency.
H1b: Channel integration positively influences the perceived supply chain transparency.
H1c: Fulfilment process efficiency positively influences perceived supply chain transparency.
H1d: Returns management efficiency positively influences perceived supply chain transparency.
2.3. Perceived Supply Chain Transparency and Customer Loyalty
Traditionally, supply chain transparency has been considered the level of transparency within a company regarding its supply, production, and distribution processes (Sodhi & Tang, 2019). Previous research has largely focused on formal disclosures such as sustainability reporting, certifications, and labels (She, 2022). These mechanisms might be applicable, but only to transparency information that firms receive passively.
Perceived supply chain transparency must not be confounded with other constructs in operation and relationship. Fulfilment-related operational dimensions relate to customers’ perceptions of operational performance and service delivery, and perceived supply chain transparency relates to customers’ beliefs that the organisation’s processes are transparent, traceable, and open to inspection. Likewise, transparency is not a relational outcome, such as trust, but rather a construct involving perceptions of openness and access to organisational processes and information. However, transparency does not equate to operational visibility; visibility is access to operational information, and perceived transparency is what the customer thinks about whether the operations of the organisation seem understandable, visible, and accountable. Perceived supply chain transparency is the degree to which customers perceive information about the retailer’s supply chain processes to be open, accessible, clear, and visible. This construct is not about the actual transparency of the supply chain or the ability to access upstream supply chain practices, but rather about how customers perceive the supply chain information is made available to them. Therefore, the construct should be treated as a customer perception of the transparency of the supply chain and not a direct representation of the customer cognitive inference process regarding the operation signals.
Observables fulfilment experiences can offer customers information that can help with their overall supply chain transparency perception from the signalling perspective. While some aspects of an organisation’s operations may be more visible to customers through timely delivery, accessible information, and consistent channel experiences, these experiences do not necessarily provide evidence of upstream sourcing or production activities (Gao & Jiang, 2025). This study thus focused on the relationship between observable dimensions of fulfilment and perceived supply chain transparency, but not on measuring the cognitive processes that customers infer.
Transparency is a key factor that can help build customer loyalty (Sansome et al. 2024). Belief in a firm indicates that customers will believe in the firm, view it as less risky, and hold a positive relational attitude (Gao & Jiang, 2025). In a sustainable market, these effects are magnified, as transparency is the hallmark of ethical behaviour and authenticity. Transparency is important in this regard to indicate operational practices and to establish behavioural outcomes. Henceforth:
H2: Perceived supply chain transparency positively affects loyalty.
2.4. Direct and Indirect Effects of Fulfilment Quality on Loyalty
Transparency is a major explanatory structure for customer loyalty; however, the quality of fulfilment can directly affect customer loyalty (Do et al., 2023). In the retail and service sectors, many studies have shown that satisfaction and trust in reliability, efficiency, and convenience are directly related to other factors that precede loyalty, such as satisfaction and trust (Mofokeng, 2023). Omnichannel retailing refers to the process of selling orders through various channels, and the role of fulfilment quality in achieving smooth transactions, value perception, and relationship building is essential.
However, regarding loyalty, the effects of fulfilment quality come in the form of an indirect pathway through the perception of transparency. The operational signals of fulfilment increase transparency and decrease uncertainty, thereby improving relational outcomes. Accordingly:
H3a: Delivery service quality positively influences customer loyalty.
H3b: Channel integration positively influences customer loyalty.
H3c: Fulfilment process efficiency positively influences customer loyalty.
H3d: Return management efficiency positively influences customer loyalty.
H4a: Supply chain transparency mediates the relationship between delivery service quality and customer loyalty
H4b: Supply chain transparency mediates the relationship between channel integration and customer loyalty
H4c: Supply chain transparency mediates the relationship between fulfilment process efficiency and customer loyalty
H4d: Supply chain transparency mediates the relationship between returns management efficiency and customer loyalty
2.5. Perceived Greenwashing as a Signal Credibility Disruptor
The reliability of signals is especially vulnerable to doubt in the sustainability field (Hoang-Tran & Duong, 2026). Perceived greenwashing refers to the extent to which customers perceive exaggeration or misrepresentation of a company’s sustainability claims (Daou et al., 2025; Suphasomboon & Vassanadumrongdee, 2026). This poses a major problem in terms of signal credibility. When sustainability information is perceived as misleading or unsubstantial, it reduces customers’ willingness to accept sustainability claims and signals (Sneideriene & Legenzova, 2025).
Perceived greenwashing is considered a moderator in this study because it can undermine the trust and credibility of transparency signals. In terms of signalling, perceived greenwashing causes negative effects on the process of information interpretation because it creates mistrust and scepticism towards the information provided (Choubey et al., 2025). Even if the dimensions of fulfilment quality result in higher perceptions of transparency, the higher transparency perceptions do not translate into greater loyalty or purchase intentions on the part of the customers because of greenwashing. The signalling effect of perceived greenwashing reduces the effectiveness of the transparency operational signals, as sustainability claims appear questionable.
Hence, customers’ perception of supply chain transparency is not directly affected by perceived greenwashing. Rather, transparency perceptions do not translate to customer loyalty as they erode the credibility of transparency-related operational signals. Given that sustainability claims are prevalent in the beauty industry, there is a need for substantiation. When they are perceived as greenwashing, the negative interpretation of these cues can affect consumer perceptions. Therefore:
H5: Perceived greenwashing weakens the positive relationship between perceived supply chain transparency and customer loyalty, thereby reducing the credibility of transparency signals.
2.6. Generational Cohort Differences in Signal Interpretation
Generational cohort theory is rooted in Mannheim’s (1952) theory of generations, which proposes that individuals who occupy similar historical and social locations may develop shared orientations through common formative experiences. (Ryder, 1965) subsequently conceptualised cohorts as aggregates of individuals who experience the same significant events within the same period, providing a basis for examining behavioural patterns across successive cohorts. In consumer research, this perspective has been applied to explain why individuals belonging to different generational cohorts may exhibit differences in values, attitudes, and behavioural tendencies arising from their formative socio-cultural, technological, and economic environments.
Building on this theoretical perspective, the present study considers generational cohort membership as a potential basis for variation in consumers’ interpretations of operational signals and perceptions of supply chain transparency. Common formative experiences may shape how customers evaluate information, organisational credibility, and sustainability-related communication. Accordingly, Gen Z and Millennials may differ in their interpretation of operational fulfilment experiences as signals of transparency in an omnichannel retail context. However, generational cohort theory does not imply that all cohort members behave identically; rather, it provides a theoretical rationale for examining whether cohort membership is associated with systematic differences in consumer responses. The theory provides the basis for the empirical comparison conducted through a multi-group analysis rather than presuming that meaningful differences exist.
Previous research indicates that Gen Z consumers tend to be more familiar with virtual environments and communication and information-verification processes related to sustainability, which could influence their scepticism towards organisations’ sustainability claims (D’Acunto et al., 2025; Wisniewski et al., 2025). However, in a digital retail setting, (Nkuna et al., 2024) found that Millennials pay greater attention to brand relationships, experiential appraisals, and service-related interactions. Such documented differences provide a rationale for examining whether the interpretation of operational signals and transparency cues varies across the two cohorts in the present study.
The generational perspective does not imply that Gen Z or Millennial consumers respond in a predetermined manner. Rather, it suggests that differences in formative experiences may be associated with variations in the interpretation of organisational signals and sustainability information. Accordingly, this study examines whether the structural relationships involving operational fulfilment signals, perceived supply chain transparency, customer loyalty, and perceived greenwashing differ between Gen Z and Millennials.
Thus, this study hypothesises that:
H6a1: The impact of delivery service quality on perceived supply chain transparency differs between Gen Z and Millennials.
H6a2: The impact of channel integration on perceived supply chain transparency differs between Gen Z and Millennials.
H6a3: The impact of fulfilment process efficiency on perceived supply chain transparency differs between Gen Z and Millennials.
H6a4: The impact of return management efficiency on perceived supply chain transparency differs between Gen Z and Millennials.
H6b: The impact of perceived supply chain transparency on customer loyalty differs between Gen Z and Millennials.
H6c: The moderating effect of perceived greenwashing on the effect of perceived supply chain transparency on customer loyalty differs between Gen Z and Millennials.
2.7. Conceptual Model
Based on signalling theory and service literature, the conceptual model in Fig. (1) was developed to assess the relationship between operational performance and customer loyalty in omnichannel retailing. The conceptual model focuses on four different operational dimensions related to fulfilment: delivery service quality, channel integration, fulfilment process efficiency, and returns management efficiency. These dimensions were chosen for separate modelling because each is an operational signal with a different ability to convey transparency to the customers. These dimensions were modelled as conceptually distinct constructs, each representing a different aspect of omnichannel fulfilment, and were examined for their respective associations with customers’ perceptions of transparency and loyalty. This study treats perceived greenwashing as a moderator variable that reduces the effectiveness of transparency signals and, in turn, their effect on customer loyalty. Finally, a generational grouping variable (Gen Z vs. Millennials) was included to describe the signal interpretation for each group of customers.
These associations offer an extensive structure for how companies can employ operational cues to create customer loyalty while considering credibility and customer heterogeneity issues.
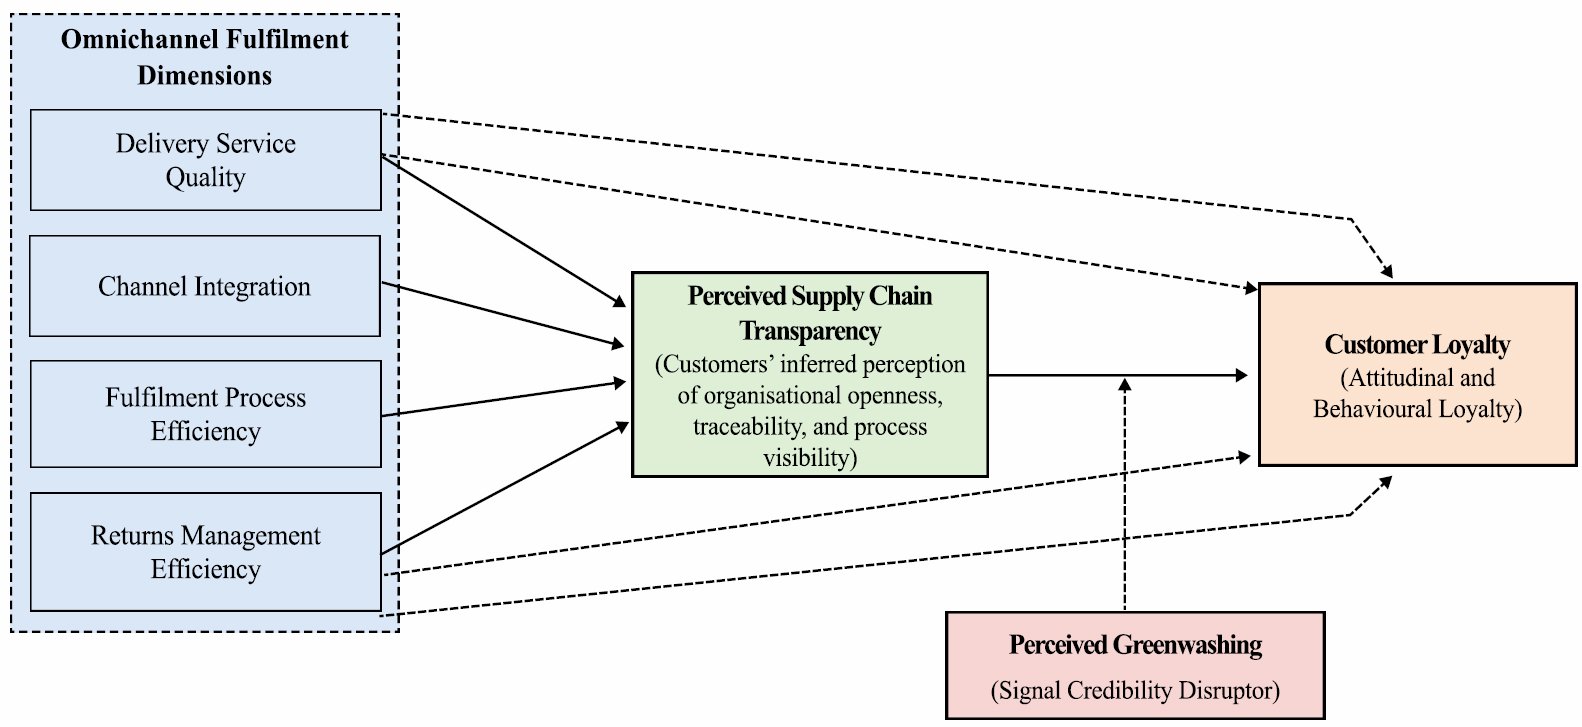
Fig. (1). Conceptual model.
3. METHODOLOGY
3.1. Research Design and Data Collection
This study used a cross-sectional quantitative design to study the relationships between selected dimensions of fulfilment, perceived supply chain transparency, perceived greenwashing, and customer loyalty in the sustainable beauty sector. Data were collected using a self-administered questionnaire (Appendix A) from Malaysian consumers who had purchased products from sustainable beauty brands through both the brands’ online and physical/offline channels. To establish a consistent focal entity across the survey, respondents were instructed to select one sustainable beauty brand that operated both online and physical/offline sales channels and base all subsequent responses on their experiences with that same brand. Thus, the focal entity in the present study was the beauty brand rather than a third-party retailer through which the brand’s products might also be sold. Data collection took place over four months (March to June 2025).
The survey was shared online through social media networks such as Facebook, Instagram, and WhatsApp. The data were examined for missing answers, inconsistent answers, and straight lines before conducting the analysis. First, the participants were asked questions about their place of residence, history of purchasing beauty products from online and offline stores, and their age before being provided access to the complete questionnaire. If a participant answered in any category other than the acceptable category, they were automatically excluded. The respondents were split into two groups for multi-group comparisons: Gen Z (18-26 years) and Millennials (27-42 years), which is similar to the previous study on generations (Pandey et al., 2025).
Prior to answering the questionnaire, the participants were provided with information on the purpose of the study, the voluntary nature of the study, the right to withdraw at any point during the study, and that their answers would be handled confidentially and anonymously. Informed consent was obtained prior to participation. No personal identification was gathered, and the data were only used for academic enquiry. The participants were also informed that there were no known risks other than those associated with participation in a consumer survey.
Purposive sampling was applied to ensure a sample with sufficient experience of digital and physical channels to evaluate aspects of fulfilment. The total number of responses obtained was 452; however, 21 responses were incomplete, nine were straight-lined, and 12 failed the screening process, which led to a final sample size of 410. In accordance with the guidelines of (Hair et al., 2022), this sample size exceeded the minimum requirement using the ten-times rule and was adequate for PLS-SEM testing.
3.2. Measurement Instrument
Each variable was measured using multi-item scales adapted from the literature. The response scale used was a 5-point Likert scale ranging from 1= strongly disagree to 5 = strongly agree. A pilot test was conducted with 30 participants prior to the final data collection to test for understanding, wording, and clarity of the questionnaire. Because the unit of customer evaluation was the focal beauty brand, all customer-facing measurement items were interpreted with reference to the selected brand and its online and physical/offline channels.
Instead of a single higher-order construct, omnichannel fulfilment quality was assessed based on four first-order constructs: delivery service quality, channel integration, fulfilment process efficiency, and returns management efficiency. The measurement items for the four omnichannel fulfilment dimensions were adapted by the authors from the conceptual logistics dimensions discussed by (Marchet et al., 2018). The mentioned study examined omnichannel logistics from an organisational perspective; therefore, their work was used as the conceptual basis for identifying relevant delivery, channel integration, fulfilment, and returns-management dimensions rather than as a source of directly validated customer-level measurement items. This study subsequently adapted and operationalised these dimensions as customer-perceived measures appropriate to the sustainable beauty retailing context. Accordingly, the items reported in Appendix B should be understood as context-specific adaptations rather than verbatim items directly validated by (Marchet et al., 2018).
Saini and Singh (2020) stated that customer loyalty is a multi-dimensional construct involving attitudinal and behavioural loyalty. Attitudinal loyalty is psychological attachment to the brand and preference, whereas behavioural loyalty is reflected in the tendency to buy and recommend the brand. Customer loyalty was modelled as a reflective construct because the measurement items were intended to capture manifestations of respondents’ underlying loyalty toward the focal beauty brand. The construct encompassed both attitudinal and behavioural intention indicators, such as the intention to continue purchasing, willingness to recommend the brand, and preference for the brand. Therefore, these indicators were treated as reflective manifestations of an underlying loyalty orientation rather than distinct dimensions that jointly formed the construct. Accordingly, the items were expected to covary as expressions of the same underlying customer loyalty disposition, and the construct was assessed using the reflective measurement model criteria reported in this study. Given this perspective, the present study adopted the first-order reflective model of customer loyalty, wherein each indicator was considered a complementary form of the same underlying construct as the customer loyalty model. The measurement model demonstrated satisfactory reliability and convergent validity, supporting this operationalisation.
Perceived supply chain transparency was modified from (Morgan et al., 2023) supplier transparency scale. The items were modified to reflect the perceived transparency of customer supply chains from the customers’ perspective. Perceived supply chain transparency was defined as the perception that customers have about the transparency, accessibility, clarity, and visibility of supply chain-related information and processes. This construct does not measure actual transparency in supply chains but rather the customers’ perceptions of such transparency. The items gauge whether customers feel they have sufficient and easy-to-access information about sourcing, production, delivery, and operational processes.
Items measuring perceived greenwashing were adapted from (Tu et al., 2024) to reflect perceptions of deceptive, extensive, or unverifiable environmental claims. Adaptations and adjustments were made to incorporate sustainability claims in the cosmetics industry. The items were selected to capture perceived exaggeration, misleadingness, insufficient substantiation, or misrepresentation of environmental performance, rather than general distrust of the brand.
Some wording changes were made to the items to be consumer-oriented for this study, as several instruments were originally developed for organisational/firm-level respondents. The changes were limited to contextual and grammatical changes, for example, replacing the organisational self-assessment statements with statements based on customer perception but not changing the conceptual definition of the constructs. The adaptations were designed to allow respondents to evaluate their perceptions of the observed fulfilment experiences of the retailer/brand rather than internal organisational processes. The adapted items were checked to ensure that their meaning, in terms of the construct, was maintained. Content validity was assessed by experts in assessing the adapted items and by pilot testing to ensure the clarity and contextual relevance of the items and that they were conceptually consistent with the original measurement scale. Appendix B provides a summary of these tools.
3.3. Data Analysis Procedure
The model was estimated using SmartPLS 4.0.9.9, which is suitable for complex models with mediation, moderation, and Multi-Group Analyses (MGA). A two-step approach was adopted: first, the measurement model was tested, and second, the path model was evaluated. The mediation effects were interpreted in accordance with (Zhao et al., 2010), who argued that a significant indirect effect without a significant direct effect was indirect-only mediation.
A non-parametric bootstrapping procedure with 5,000 resamples was used to evaluate the significance of the structural relationships. The significance of the direct, indirect, and moderating effects was estimated using a bootstrap analysis. To estimate the moderating effect of perceived greenwashing, the Product Indicator approach in SmartPLS was used, which is suitable for modelling interactions between reflective constructs. The dataset was reviewed for missing and inconsistent responses prior to the analysis. During the data cleaning process, incomplete questionnaires were excluded, and the dataset had no missing values; therefore, data imputation was unnecessary.
The MGA was used to examine the structural path coefficients between Gen Z and Millennials to test for cohort differences. The MGA examines differences in relationships across groups rather than interaction effects, thereby identifying group differences in the interpretation of signals. Once partial measurement invariance was achieved using the MICOM procedure, differences in the structural path coefficients were tested using Welch’s t-test.
Since the data were self-reported, procedural and statistical controls were used to minimise common method bias. Harman’s single-factor test revealed no dominant factors. Common method bias was minimised using procedural remedies and assessed using statistical diagnostics, that is, full collinearity VIF, to determine if common method variance was a serious concern for the validity of the results. The instructions in the questionnaire explicitly stated that there were no right or wrong answers, but that respondents should respond honestly. Items representing the different constructs were presented in a logical sequence, and previously validated measurement scales were used to clarify the measurement and minimise item ambiguity.
Table 1 shows that the full collinearity VIF values ranged from 1.004 to 2.848, which were below the conservative threshold of 3.3 recommended by (Kock, 2015) for evaluating potential common method biases. Based on these findings, common method bias is not likely to be a major threat to the validity of the structural relationships.
Table 1. Full collinearity values.
| Construct | Full Collinearity VIF |
| Customer Loyalty | 1.416 |
| Delivery Service Quality | 2.848 |
| Channel Integration | 2.234 |
| Fulfilment Process Efficiency | 1.004 |
| Perceived Greenwashing | 1.076 |
| Perceived Supply Chain Transparency | 1.705 |
| Returns Management Efficiency | 2.711 |
4. RESULTS
In this study, the PLS-SEM technique was adopted to assess the relationships among omnichannel fulfilment dimensions, perceived supply chain transparency, perceived greenwashing, and customer loyalty for Gen Z and Millennials. The analysis was carried out in two stages: first, the measurement model was tested, and second, the structural model was tested using AMOS. To explore the generational differences between Gen Z and Millennials, the MGA and Measurement Invariance of Composite Models (MICOM) procedures were used. The reported results were derived from the final statistical results presented in the tables.
4.1. Demographic Profile of Respondents
The demographic data of the respondents are presented in Table 2. A total of 410 valid responses were obtained from consumers with omnichannel beauty experience. As is common in the beauty industry, most respondents were women. The sample was reasonably balanced, with both Gen Z and Millennial consumers, allowing multiple comparisons across groups. Most respondents held an undergraduate or postgraduate qualification and purchased beauty products monthly, indicating familiarity with omnichannel fulfilment processes. The overall demographic profile suggested that the sample was suitable for the purpose of the study to explore the perceptions of fulfilment quality dimensions, supply chain transparency, perceived greenwashing, and customer loyalty in sustainable beauty retail.
Table 2. Demographic analysis.
| Variable | Category | Frequency (n) | Percentage (%) |
| Gender | Male | 148 | 36.1 |
| Female | 262 | 63.9 | |
| Age Group | Gen Z (18–26 years) | 205 | 50.0 |
| Millennials (27–42 years) | 205 | 50.0 | |
| Education Level | Intermediate/A-Level | 54 | 13.2 |
| Undergraduate | 196 | 47.8 | |
| Postgraduate | 143 | 34.9 | |
| Other | 17 | 4.1 | |
| Monthly Income | Below RM 3,000 | 121 | 29.5 |
| RM 3,001 – RM 6,000 | 154 | 37.6 | |
| RM 6,001 – RM 10,000 | 83 | 20.2 | |
| Above RM 10,000 | 52 | 12.7 | |
| Employment Status | Student | 132 | 32.2 |
| Employed | 201 | 49.0 | |
| Self-employed | 46 | 11.2 | |
| Unemployed | 31 | 7.6 | |
| Frequency of Beauty Product Purchase | Weekly | 74 | 18.0 |
| Monthly | 187 | 45.6 | |
| Every 2–3 Months | 103 | 25.1 | |
| Rarely | 46 | 11.2 |
4.2. Measurement Model Assessment
The indicator reliability, internal consistency, convergent validity, and Average Variance Extracted (AVE) are presented in Table 3 to estimate the measurement model. The reliability of the indicators was satisfactory for both generational groups in the outer loading results. The loadings of most indicators were higher than the recommended value of 0.70, as suggested by (Usakli & Kucukergin, 2018). Within the Gen Z subgroup, a few customer loyalty indicators had loadings just below the general standard of 0.70, which was acceptable. These indicators were retained because the constructs maintained acceptable composite reliability and AVE, and their removal was considered potentially detrimental to content coverage. These indicators would have limited the conceptualisation of customer loyalty to attitudinal and behavioural aspects if they had not been included.
Table 3. Measurement model assessment.
| Construct | Gen Z | Millennials | ||||||
| Loading (GZ) | α (GZ) | CR (GZ) | AVE (GZ) | Loading (ML) | α (ML) | CR (ML) | AVE (ML) | |
| Customer Loyalty | 0.749 | 0.839 | 0.878 | 0.508 | 0.779 | 0.886 | 0.911 | 0.596 |
| 0.692 | 0.819 | |||||||
| 0.672 | 0.774 | |||||||
| 0.769 | 0.759 | |||||||
| 0.656 | 0.813 | |||||||
| 0.753 | 0.734 | |||||||
| 0.688 | 0.718 | |||||||
| Delivery Service Quality | 0.865 | 0.785 | 0.874 | 0.697 | 0.850 | 0.796 | 0.880 | 0.710 |
| 0.844 | 0.823 | |||||||
| 0.795 | 0.854 | |||||||
| Channel Integration | 0.858 | 0.814 | 0.890 | 0.729 | 0.840 | 0.810 | 0.888 | 0.725 |
| 0.880 | 0.825 | |||||||
| 0.822 | 0.889 | |||||||
| Fulfilment Process Efficiency | 0.848 | 0.803 | 0.884 | 0.717 | 0.821 | 0.803 | 0.883 | 0.717 |
| 0.865 | 0.869 | |||||||
| 0.827 | 0.849 | |||||||
| Perceived Greenwashing | 0.712 | 0.867 | 0.898 | 0.595 | 0.850 | 0.901 | 0.922 | 0.665 |
| 0.783 | 0.825 | |||||||
| 0.743 | 0.772 | |||||||
| 0.821 | 0.814 | |||||||
| 0.795 | 0.853 | |||||||
| 0.771 | 0.776 | |||||||
| Supply Chain Transparency | 0.804 | 0.842 | 0.888 | 0.613 | 0.813 | 0.870 | 0.906 | 0.658 |
| 0.759 | 0.807 | |||||||
| 0.805 | 0.824 | |||||||
| 0.782 | 0.831 | |||||||
| 0.763 | 0.779 | |||||||
| Returns Management Efficiency | 0.863 | 0.833 | 0.899 | 0.748 | 0.812 | 0.780 | 0.872 | 0.695 |
| 0.884 | 0.858 | |||||||
| 0.848 | 0.830 | |||||||
Note: Indicators with loadings slightly below 0.70 were retained because the CR and AVE exceeded the recommended thresholds.
The Cronbach’s alpha values for Gen Z ranged from 0.785 to 0.867, while the composite reliability ranged from 0.874 to 0.899. Likewise, the internal consistency reliability (composite) of the Millennials ranged from 0.872 to 0.922, and Cronbach’s alpha reliability ranged from 0.780 to 0.901 for the Millennials. According to (Sarstedt et al., 2022), the values of the constructs were above the threshold of 0.70, indicating that the overall internal consistency and reliability of the constructs were good. Furthermore, the AVEs computed for all constructs in the Gen Z and Millennial groups exceeded the minimum criterion of 0.50, ranging from 0.595 to 0.748 for Gen Z and 0.658 to 0.725 for Millennials, as detailed by (Mohd Dzin & Lay, 2021). The results indicate the acceptable convergent validity of the measurement model.
To test the discriminant validity, the Heterotrait-Monotrait (HTMT) criterion was used (Table 4). All values of the constructs were below 0.85 (which is the criterion recommended by Yusoff et al., 2020), indicating satisfactory discriminant validity for both generational groups. Considering the somewhat overlapping nature of perceived greenwashing and supply chain transparency, it was important to assess their HTMT values. Empirically, the constructs of perceived greenwashing and perceived supply chain transparency were distinguished with values of 0.109 among Generation Z and 0.079 among Millennials. In general, the results validated the measurement model as reliable and valid for both generational groups.
Table 4. Heterotrait-monotrait matrix.
| Construct | Gen Z | Millennials | ||||||||||||
| CL | DSQ | CI | FPE | GW | PSCT | RME | CL | DSQ | CI | FPE | GW | PSCT | RME | |
| Customer Loyalty (CL) | – | 0.178 | 0.184 | 0.130 | 0.148 | 0.360 | 0.118 | – | 0.494 | 0.452 | 0.429 | 0.219 | 0.640 | 0.459 |
| Delivery Service Quality (DSQ) | – | – | 0.024 | 0.066 | 0.106 | 0.533 | 0.158 | – | – | 0.784 | 0.684 | 0.094 | 0.678 | 0.250 |
| Channel Integration (CI) | – | – | – | 0.029 | 0.074 | 0.487 | 0.304 | – | – | – | 0.234 | 0.093 | 0.661 | 0.017 |
| Fulfilment Process Efficiency (FPE) | – | – | – | – | 0.136 | 0.511 | 0.264 | – | – | – | – | 0.117 | 0.683 | 0.026 |
| Perceived Greenwashing (GW) | – | – | – | – | – | 0.109 | 0.097 | – | – | – | – | – | 0.079 | 0.077 |
| Supply Chain Transparency (PSCT) | – | – | – | – | – | – | 0.448 | – | – | – | – | – | – | 0.622 |
Table 5 presents the effect sizes (f²) for each generation. The results showed that the effect sizes were small to very low for most relationships, suggesting that individual relationships were modest contributors to endogenous constructs. The largest effect size was observed for perceived supply chain transparency → customer loyalty among Millennials (f² = 0.236), whereas the corresponding effect among Gen Z was smaller (f² = 0.089). Small effects were also observed on Millennials’ perception of supply chain transparency regarding delivery service quality and the efficiency of the delivery process. Overall, the findings indicate that supply chain transparency has the greatest impact on customer loyalty in both generations.
Table 5. Effect size assessment.
| Structural Path | Gen Z | Millennials | ||
| f² | Effect Size | f² | Effect Size | |
| Delivery Service Quality → Customer Loyalty | 0.002 | Negligible | 0.006 | Negligible |
| Delivery Service Quality → Perceived Supply Chain Transparency | 0.020 | Small | 0.029 | Small |
| Channel Integration → Customer Loyalty | 0.006 | Negligible | 0.000 | Negligible |
| Channel Integration → Perceived Supply Chain Transparency | 0.001 | Negligible | 0.013 | Negligible |
| Fulfilment Process Efficiency → Customer Loyalty | 0.002 | Negligible | 0.001 | Negligible |
| Fulfilment Process Efficiency → Perceived Supply Chain Transparency | 0.005 | Negligible | 0.032 | Small |
| Perceived Greenwashing × Perceived Supply Chain Transparency → Customer Loyalty | 0.002 | Negligible | 0.006 | Negligible |
| Perceived Supply Chain Transparency → Customer Loyalty | 0.089 | Small | 0.236 | Medium |
| Returns Management Efficiency → Customer Loyalty | 0.009 | Negligible | 0.003 | Negligible |
| Returns Management Efficiency → Perceived Supply Chain Transparency | 0.000 | Negligible | 0.002 | Negligible |
Table 6 reports the positive Q² predict values for the overall sample, representing the two groups. Positive Q² values indicate that the model has a predictive assessment, making it a better predictor of endogenous constructs than simple benchmarks. However, Q² is insufficient for determining the out-of-sample predictive ability. Perceived supply chain transparency had relatively higher predictive relevance (Q² = 0.280), indicating that the model can predict consumer perception of transparency along the supply chain. Likewise, customer loyalty yielded a positive Q² predictive value but was comparatively lower than transparency (Q2 = 0.125). Overall, the results suggest that the structural model has good predictive relevance for the constructs of perceived supply chain transparency and customer loyalty in omnichannel retailing.
Table 6. Predictive relevance.
| Construct | Q²predict |
| PSCT | 0.280 |
| Customer Loyalty | 0.125 |
4.3. Assessment of Explanatory Power
The coefficient of determination (R²) suggests varying degrees of explanatory power for the two generational cohorts (Table 7). The model explained 20.4% of the variance in perceived supply chain transparency and 13.0% of the variance in customer loyalty among Gen Z consumers. However, the model had relatively greater explanatory power for Millennials, explaining 37.2% and 38.0% of the variance in perceived supply chain transparency and customer loyalty, respectively. The results indicate that perceptions of transparency and operational cues related to fulfilment are more explanatory of customer loyalty among Millennials than among Generation Z customers.
Table 7. Structural model assessment.
| Endogenous Construct | Gen Z | Millennials | ||
| R² | Adjusted R² | R² | Adjusted R² | |
| Customer Loyalty | 0.130 | 0.097 | 0.380 | 0.359 |
| Perceived Supply Chain Transparency | 0.204 | 0.187 | 0.372 | 0.360 |
4.4. Path Coefficients Assessment
Table 8 presents the extent to which the proposed hypotheses are supported by the structural model. Among Gen Z consumers, delivery service quality was positively and significantly associated with perceived supply chain transparency (p = 0.023; β = 0.260). Likewise, delivery service quality significantly and positively affected Millennials’ perception of supply chain transparency (β = 0.258, t = 2.306, p = 0.021). These results support H1a for both Gen Z and Millennials.
Table 8. Path coefficients.
| Hypothesised Path | Gen Z | Millennials | ||
| β | t | β | t | |
| Delivery Service Quality → Customer Loyalty | 0.081 | 0.535 | 0.118 | 1.128 |
| Delivery Service Quality → Supply Chain Transparency | 0.260** | 2.275 | 0.258** | 2.306 |
| Channel Integration → Customer Loyalty | 0.160 | 0.916 | -0.002 | 0.022 |
| Channel Integration → Supply Chain Transparency | 0.061 | 0.407 | 0.181 | 1.560 |
| Fulfilment Process Efficiency → Customer Loyalty | -0.084 | 0.540 | -0.057 | 0.517 |
| Fulfilment Process Efficiency → Supply Chain Transparency | 0.135 | 1.070 | 0.277** | 2.358 |
| Greenwashing × Transparency → Customer Loyalty | -0.080** | 1.980 | 0.067 | 0.925 |
| Supply Chain Transparency → Customer Loyalty | 0.312*** | 3.723 | 0.484*** | 7.384 |
| Returns Management Efficiency → Customer Loyalty | -0.169 | 1.227 | 0.093 | 0.839 |
| Returns Management Efficiency → Supply Chain Transparency | 0.020 | 0.177 | -0.066 | 0.596 |
| Perceived Greenwashing → Customer Loyalty | −0.032 | 0.568 | −0.023 | 0.603 |
Note: Significance p < 0.1: *, p < 0.05: **, p < 0.01: ***
However, H1b was not supported because channel integration was not significantly associated with perceived supply chain transparency in either Generation Z or Millennials. Similarly, Returns Management Efficiency was not significantly associated with perceived supply chain transparency in either cohort. Fulfilment Process Efficiency was not significantly associated with perceived supply chain transparency among Gen Z consumers (β = 0.135, p = 0.285), whereas the association was positive and statistically significant among Millennials (β = 0.277, p = 0.018).
The findings also indicate that both groups had a statistically significant positive structural relationship between perceived supply chain transparency and customer loyalty. There was a significant influence of supply chain transparency on customer loyalty among Gen Z (β = 0.312, t = 3.723, p < 0.001); the Millennial group also showed a statistically significant result for the relationship between transparency and loyalty; however, the estimated coefficient was numerically larger for Millennials (β = 0.484, t = 7.384, p < 0.001). Thus, H2 was supported in both cohorts.
The direct links between fulfilment dimensions and customer loyalty mainly generated non-significant results. For both groups, delivery service quality, channel integration, fulfilment process efficiency, and return management efficiency were not found to have a statistically significant direct effect on loyalty. Thus, H3a–H3d are not supported.
Differences were observed within groups, but no differences were detected between groups using MGA. The interaction between perceived greenwashing and perceived supply chain transparency was negative and statistically significant among Gen Z consumers (β = −0.080, t = 1.980, p < .05), indicating that higher perceived greenwashing was associated with a weaker positive structural association between perceived supply chain transparency and brand loyalty. The effect size was negligible (f² = 0.002). Among Millennials, the interaction was not statistically significant (β = 0.067, t = 0.925, p = .355), with a negligible effect size (f² = 0.006).
The direct effect of perceived greenwashing on the customer loyalty of Gen Z and Millennial consumers was not statistically significant (β = −0.032, t = 0.568, p = 0.570; β = −0.023, t = 0.603, p = 0.546, respectively). These results indicate that the direct association between perceived greenwashing and customer loyalty was not statistically significant in either cohort, whereas its interaction with perceived supply chain transparency was statistically significant only among Gen Z.
4.5. Mediation Results
To test the mediating effect of perceived supply chain transparency between omnichannel fulfilment dimensions and customer loyalty, a mediation analysis was performed (Table 9). The mediation analysis found indirect-only mediation in the case of delivery service quality on customer loyalty and fulfilment process efficiency on customer loyalty in the millennial group. The results indicate that these dimensions of fulfilment have statistically significant indirect associations with customer loyalty through perceived supply chain transparency among Millennials. There were no significant mediation effects in terms of channel integration or return management efficiency for the Gen Z group.
Table 9. Mediation results.
| Indirect Path | Gen Z | Millennials | ||||
| β | t | p | β | t | p | |
| Returns Management Efficiency → Supply Chain Transparency → Customer Loyalty | 0.006 | 0.171 | 0.865 | -0.032 | 0.595 | 0.552 |
| Delivery Service Quality → Supply Chain Transparency → Customer Loyalty | 0.081* | 1.786 | 0.074 | 0.125** | 2.239 | 0.025 |
| Channel Integration → Supply Chain Transparency → Customer Loyalty | 0.019 | 0.389 | 0.698 | 0.088 | 1.527 | 0.127 |
| Fulfilment Process Efficiency → Supply Chain Transparency → Customer Loyalty | 0.042 | 1.020 | 0.308 | 0.134** | 2.211 | 0.027 |
Note: Significance p < 0.1: *, p < 0.05: **, p < 0.01: ***
However, for Millennials, perceived supply chain transparency was a statistically significant mediator between delivery service quality and customer loyalty (β = 0.125, t = 2.239, p = 0.025). Transparency also serves as an important mediator between fulfilment process efficiency and customer loyalty (β = 0.134, t = 2.211, p = 0.027). For the remaining fulfilment dimensions i.e., channel integration and returns management efficiency, transparency did not act as a statistically significant mediator/
The findings suggest that among Millennials, some operational fulfilment dimensions are indirectly associated with customer loyalty via perceived supply chain transparency. Accordingly, H4a–H4d were partially supported: H4a and H4c were supported among Millennials, whereas H4b and H4d were not, and none of the four indirect effects were significant for Generation Z.
4.6. MICOM and MGA
As presented in Table 10, most constructs showed full or partial measurement invariance, allowing for a careful comparison between Gen Z and Millennials. However, customer loyalty did not exhibit compositional invariance (p = 0.023). Therefore, the results of the MGA comparisons are not definitive evidence of generational differences in customer loyalty. The fulfilment–loyalty relationship, perceived supply chain transparency–loyalty relationship, and perceived greenwashing moderation of the transparency–loyalty relationship were discussed as exploratory comparisons. Therefore, any lack of a significant difference between groups should not be considered as evidence that the relationships between individuals are the same within these two groups.
Table 10. Mean variance and compositional invariance.
| Construct | Compositional Invariance (p-value) | Mean Invariance (p-value) | Variance Invariance (p-value) | Invariance Conclusion |
| Customer Loyalty | 0.023 | 0.000 | 0.011 | Partial invariance not established |
| Delivery Service Quality | 0.241 | 0.683 | 0.995 | Full invariance established |
| Channel Integration | 0.308 | 0.059 | 0.863 | Full invariance established |
| Fulfilment Process Efficiency | 0.510 | 0.000 | 0.274 | Partial invariance established |
| Perceived Greenwashing | 0.179 | 0.000 | 0.063 | Partial invariance established |
| Perceived Supply Chain Transparency | 0.750 | 0.000 | 0.384 | Partial invariance established |
| Returns Management Efficiency | 0.731 | 0.919 | 0.150 | Full invariance established |
After establishing the required level of measurement invariance using MICOM, the Welch–Satterthwaite procedure was used to test the structural path differences between Gen Z and Millennials (Table 11). Because customer loyalty did not establish compositional invariance, comparisons involving this construct were treated as exploratory.
Table 11. Welch-satterthwait test.
| Structural Path | Path Difference | t-value | p-value |
| Delivery Service Quality → Customer Loyalty | -0.037 | 0.203 | 0.839 |
| Delivery Service Quality → Perceived Supply Chain Transparency | 0.003 | 0.016 | 0.987 |
| Channel Integration → Customer Loyalty | 0.163 | 0.793 | 0.429 |
| Channel Integration → Perceived Supply Chain Transparency | -0.120 | 0.633 | 0.527 |
| Fulfilment Process Efficiency → Customer Loyalty | -0.027 | 0.143 | 0.886 |
| Fulfilment Process Efficiency → Perceived Supply Chain Transparency | -0.142 | 0.824 | 0.411 |
| Perceived Greenwashing × Perceived Supply Chain Transparency → Customer Loyalty | -0.020 | 0.187 | 0.852 |
| Perceived Supply Chain Transparency → Customer Loyalty | -0.172 | 1.620 | 0.107 |
| Returns Management Efficiency → Customer Loyalty | -0.262 | 1.485 | 0.139 |
| Returns Management Efficiency → Perceived Supply Chain Transparency | 0.086 | 0.547 | 0.585 |
No statistical difference was detected between the structural paths of Gen Z and Millennials in the MGA results. However, because Customer Loyalty did not show compositional invariance, the differences that involved this construct, such as paths from fulfilment to loyalty, transparency of the supply chain to loyalty, and the moderating effect of perceived greenwashing on the transparency-loyalty relationship, were interpreted as exploratory. Thus, the absence of significant group differences in the present sample should be interpreted as a lack of statistical detection of group differences, not as measurement-equivalent structural relationships between the two cohorts. Thus, H6a1–H6a4 were not supported because none of the four fulfilment-to-transparency path differences between Gen Z and Millennials were statistically significant.
The Welch–Satterthwaite comparison indicated that H6b was not supported (p = 0.107). Because customer loyalty was not found to be compositional invariant, this comparison is treated as an exploratory comparison rather than as confirmatory evidence that the transparency–loyalty relationship is the same for both cohorts. Because the moderation path difference was not significant (p = 0.852), H6c was not supported. Since there is no compositional invariance for customer loyalty, the result should be interpreted with caution and should not be interpreted as measurement equivalent moderation between Gen Z and Millennials.
5. DISCUSSION
This study focused on the effect of the operational dimensions of fulfilment as cues that customers can use to form judgments about supply chain transparency in an omnichannel retail context. These findings are consistent with signalling theory and provide an in-depth understanding of the effects of operational fulfilment signals on Gen Z and Millennial transparency perceptions and purchasing behaviour.
H1a–H1d suggested that a positive relationship exists between all fulfilment quality dimensions (i.e., delivery service quality, channel integration, fulfilment process efficiency, and returns management efficiency) and perceived supply chain transparency. H1a was supported, H1b was not supported, H1c was supported for Millennials but not Gen Z, and H1d was not supported. In both cohorts, perceived supply chain transparency was positively related to delivery service quality, with small practical significance. The association between fulfilment process efficiency and transparency was statistically significant for Millennials and had a small effect size, suggesting a limited practical impact. As the MGA did not find a statistically significant difference between cohorts, it should not be assumed that this pattern represents an increase in the importance placed on the efficiency of the fulfilment process for Millennials. Instead, this suggests that this relationship was observed within the Millennial sample. This is also in line with (Peinkofer & Jin, 2023), who posited that the transparency of fulfilment and reliability of operations decrease uncertainty and increase customer perception. (Avvad et al., 2026) proposed that fulfilment competencies are measurable factors for an organisation’s success in an omnichannel retail context. The results show that the transparency of operations and the accountability of the organisation towards customers is timely delivery, service reliability, and service fulfilment. However, channel integration and returns management efficiency did not significantly affect transparency perceptions. This partially challenges the findings of (Yumurtacı Hüseyinoğlu et al., 2018), who found that integration and return processes are significant quality factors in the omnichannel experience. One possible explanation is that channel integration may become a normal part of the omnichannel retail experience, rather than a unique transparency signal. Likewise, returns management may have failed to be an effective transparency signal because the return processes may be linked to extra transportation, packaging, and disposal of the product. However, these explanations were not directly addressed in the present study and should, therefore, be interpreted with caution. Future studies should explore the underlying mechanisms of why these dimensions of fulfilment do not appear to be important transparency signals.
A significant implication of these results is that the dimensions of fulfilment are not necessarily equally informative as operational signals. The dimensions of fulfilment did not exhibit identical patterns of statistical significance across the two samples, although the MGA did not establish statistically significant differences between the cohorts. Delivery service quality was positively and significantly associated with perceived supply chain transparency in both the Gen Z and Millennial samples, with small effect sizes in both groups. However, in this study, the efficiency of channel integration and return management did not act as effective transparency signals. These findings imply that when customers perceive transparency, they tend to focus on high-visibility fulfilment experiences before background operational capabilities.
H2 is supported, indicating a positive association between customer loyalty and supply chain transparency for both groups. This aligns with the findings of (Sansome et al., 2024), who indicated that transparency enhances trust and relational outcomes, and (Gao & Jiang, 2025), who showed a positive impact of transparency on long-term customer engagement in an omnichannel setting. The coefficient for the Millennial cohort was numerically greater than that for the other cohorts, but there was no statistically significant difference between the cohorts. The findings indicate that the perceived transparency of the supply chain positively affects customer loyalty in both generations, and that there is no empirical evidence of generational differences. The results add to transparency research by revealing that customers’ perceived transparency of supply chains is positively linked to their observable fulfilment experiences. This means that when customers make transparency judgments, they may draw on their operational experiences, in addition to what they are told in formal communication, but the current measure does not directly capture the cognitive inference process by which such judgments are made.
Overall, the results did not support H3, which predicted a direct positive relationship between the dimensions of fulfilment and customer loyalty. None of the four dimensions of fulfilment showed a statistically significant direct association with customer loyalty in either cohort within the specified structural models. These results contradict those of previous studies, which have shown that service quality is associated with improved satisfaction and loyalty (Do et al., 2023; Mofokeng, 2023). With sustainability-related omnichannel marketing, the findings suggest that customers may not base their loyalty solely on the fulfilment quality dimensions. However, the mediation results indicate that some dimensions of fulfilment are indirectly associated with customer loyalty through perceived supply chain transparency, particularly among Millennials. The non-significant direct paths indicate that the study did not detect statistically significant direct associations between the four dimensions of fulfilment and customer loyalty in the specified model. However, these results should not be interpreted as evidence that the dimensions of fulfilment do not influence loyalty. The mediation analysis provided more specific evidence for the indirect relationships: perceived supply chain transparency significantly mediated the relationships between delivery service quality and customer loyalty and between fulfilment process efficiency and customer loyalty among Millennials, whereas the corresponding indirect effects were not statistically significant for Gen Z. No statistically significant indirect effects were detected for channel integration or return management efficiency in either cohort.
Accordingly, H4 received partial support because perceived supply chain transparency significantly mediated the relationships between delivery service quality and customer loyalty and between fulfilment process efficiency and customer loyalty among Millennials, whereas the corresponding indirect effects were not statistically significant for Gen Z or for channel integration and return management efficiency. This is in line with signalling theory, which suggests that visible operational signals can influence customers’ overall perception of the organisation (Mollenkopf et al. 2022). However, the present measurement reflects a customer’s perception of transparency, not the cognitive inference process itself; therefore, this interpretation must be interpreted as a theoretical explanation for the observed relationship rather than as a direct test of customers’ inference processes.
Moderation analysis provided limited support for H5. Among Gen Z consumers, the interaction between perceived greenwashing and perceived supply chain transparency was negative and statistically significant (β = −0.080, t = 1.980, p < 0.05), indicating that higher perceived greenwashing was associated with a weaker positive structural association between perceived supply chain transparency and brand loyalty. However, the interaction effect had a negligible effect size (f² = 0.002), indicating a limited practical contribution to the explained variance in customer loyalty. Among Millennials, the interaction was not statistically significant (β = 0.067, t = 0.925, p = 0.355), and the effect size was negligible (f² = 0.006). Thus, the moderation result provided statistical support for H5 only within the Gen Z group, although the interaction effect was small.
Finally, H6a, H6b, and H6c suggested that the interpretation of operational fulfilment signals, perceptions of transparency, and credibility evaluations of greenwashing would be affected by generational cohort membership. The MGA results did not reveal any significant differences between Gen Z and Millennials in any of the proposed structural relationships, although the rationale for analysing cohort-based differences was based on Generational Cohort Theory. These results provide no statistically significant evidence that the tested signalling relationships differ between the two cohorts. In the present study, delivery service quality was positively and significantly associated with perceived supply chain transparency in both cohorts. However, the MGA did not establish a statistically significant difference between the corresponding path coefficients. Overall, no statistically significant between-group differences were detected in the structural paths tested. However, the failure to establish compositional invariance for customer loyalty limits the extent to which cohort comparisons involving this construct can be interpreted. Accordingly, the cohort-specific results are presented as within-group structural associations rather than as evidence that Gen Z and Millennials differ in their underlying relationships.
CONCLUSION
The results revealed that delivery service quality was the only fulfilment dimension that showed a statistically significant positive association with perceived supply chain transparency in both cohorts, whereas the other dimensions exhibited context-dependent or non-significant associations. The perceived transparency of the supply chain was then linked to customer loyalty. These results indicate that customers’ observable operational experiences may be associated with their perceptions of supply chain transparency from a signalling perspective. Although perceived supply chain transparency was directly measured in this study, the cognitive inference process through which customers may translate operational experiences into transparency judgements was not directly measured. However, no statistically significant differences were found between Gen Z and Millennials in the tested structural relationships. Customer loyalty did not establish compositional invariance in the MICOM assessment. Consequently, MGA comparisons involving structural paths to or from customer loyalty should be interpreted cautiously because the measurement equivalence requirements were not fully established for this construct. Comparisons involving constructs for which the required invariance was established, can be interpreted in accordance with the MICOM procedure.
The MGA results did not identify statistically significant between-group differences in the tested structural paths. However, the interpretation of paths involving Customer Loyalty requires particular caution because compositional invariance was not established for this construct. This limitation does not invalidate the MGA results involving constructs for which the required measurement invariance was established; rather, it restricts the extent to which between-cohort comparisons involving Customer Loyalty can be interpreted. Accordingly, the cohort-specific findings involving Customer Loyalty are treated as exploratory, whereas comparisons involving constructs that satisfied the relevant MICOM requirements remain interpretable within the scope of the procedure.
LIMITATIONS AND FUTURE DIRECTION
Several weaknesses of these empirical findings should be noted. The cross-sectional study design precluded causal interpretation. Longitudinal designs could be adopted in future research to examine the development of transparency perceptions and relationships across several omnichannel interactions. Second, it was limited to the sustainable beauty industry, meaning that the findings might not be generalisable to other contexts. The findings of this study may be applied to other retail sectors, including fashion, grocery, and luxury retail, to explore whether there are common properties of operational transparency signals across these sectors. Organisations must avoid activities that can be interpreted as greenwashing. The findings suggest that observable fulfilment experiences may be relevant to customers’ perceptions of supply chain transparency, which was positively associated with customer loyalty in the specified model. Moreover, the effect of perceived greenwashing on loyalty can be further studied based on differences among retail environments and sustainability categories.
Another limitation is related to measuring perceived supply chain transparency. The instrument measures customer perceptions of information availability, openness, accessibility, and visibility, but not the cognitive inference process that may be involved in transparency judgments derived from operational experiences. Therefore, the interpretation of the signalling should be viewed as a theoretical interpretation of the observed associations and not as a direct measure of customers’ inferential processing. Future studies should construct and evaluate explicit measures of perceived disclosure versus transparency based on operational experiences and use longitudinal or experimental designs to test these mechanisms. Another restriction is related to the measurement invariance of generational cohorts. Although most constructs achieved full or partial invariance, customer loyalty failed to achieve compositional invariance in the MICOM assessment. Therefore, MGA comparisons with customer loyalty were not considered a complete confirmation of generational differences. Before drawing conclusions from the structural level with respect to cohorts, further research is needed to validate the loyalty measure across generational cohorts and to test for measurement equivalence between different alternative operationalisations. Finally, the current study only examined perceived greenwashing as a credibility disruptor; future research could investigate other psychological or contextual factors that influence how consumers interpret sustainability-related operational signals in an omnichannel context, such as consumer cynicism, perceived authenticity, and trust-repair strategies.
LIST OF ABBREVIATIONS
AVE | = | Average Variance Extracted |
MGA | = | Multi-Group Analyses |
MICOM | = | Measurement Invariance of Composite Models |
AUTHORS’ CONTRIBUTIONS
S.A.K. and I.I. have contributed to the study conceptualization, methodology, data analysis, interpretation of results, and manuscript writing.
ETHICAL APPROVAL & INFORMED CONSENT
The research was conducted in accordance with established ethical principles, ensuring participant confidentiality, anonymity, and data protection. The participants were provided with information on the purpose of the study, the voluntary nature of the study, the right to withdraw at any point during the study, and that their answers would be handled confidentially and anonymously. Informed consent was obtained prior to participation. No personal identification was gathered, and the data were only used for academic enquiry. The participants were also informed that there were no known risks other than those associated with participation in a consumer survey.
AVAILABILITY OF DATA AND MATERIALS
The data will be made available on reasonable request by contacting the corresponding author [S.A.K.].
FUNDING
None.
CONFLICT OF INTEREST
The authors declare that there is no conflict of interest regarding the publication of this article.
ACKNOWLEDGEMENTS
Declared none.
DECLARATION OF AI
During the preparation of this manuscript, the authors used ChatGPT for language editing and refinement purposes. Following the use of this tool, the authors carefully reviewed and revised the content where necessary and accepts full responsibility for the final published version of the article.
APPENDICES
Appendix A: Survey Questionnaire
- Gender
- Male
- Female
- Age
- (18-26 years) Group 1 (Gen Z)
- (27-42 years) Group 2 (Millennials)
- Education level
- Intermediate/A-Level
- Undergraduate
- Postgraduate
- Other
- Monthly income
- Below RM 3,000
- RM 3,001 – RM 6,000
- RM 6,001 – RM 10,000
- Above RM 10,000
- Employment status
- Student
- Employed
- Self-employed
- Unemployed
- Frequency of beauty product purchase
- Weekly
- Monthly
- Every 2 to 3 Months
- Rarely
Please think of a sustainable beauty brand that operates its own online and physical/offline sales channels and from which you have personally purchased through both channels. Select one brand and keep this same brand in mind when answering all the questions below. Please base your responses on your experiences with this brand’s online and offline channels.
| – | Strongly Agree | Agree | Neutral | Disagree | Strongly Disagree |
| Omnichannel Fulfilment | [ ] | [ ] | [ ] | [ ] | [ ] |
| Delivery Service Quality | [ ] | [ ] | [ ] | [ ] | [ ] |
| The brand offers flexible delivery options (e.g., home delivery and pickup). | [ ] | [ ] | [ ] | [ ] | [ ] |
| Deliveries are completed within the promised time frame. | [ ] | [ ] | [ ] | [ ] | [ ] |
| Delivery services were reliable and consistent. | [ ] | [ ] | [ ] | [ ] | [ ] |
| Channel Integration | [ ] | [ ] | [ ] | [ ] | [ ] |
| I can easily switch between online and offline channels. | [ ] | [ ] | [ ] | [ ] | [ ] |
| Product availability is consistent across different channels. | [ ] | [ ] | [ ] | [ ] | [ ] |
| The brand provides seamless experiences across channels. | [ ] | [ ] | [ ] | [ ] | [ ] |
| Fulfilment Process Efficiency | [ ] | [ ] | [ ] | [ ] | [ ] |
| My orders are processed quickly after the purchase. | [ ] | [ ] | [ ] | [ ] | [ ] |
| The fulfilment process was efficient and well-organised. | [ ] | [ ] | [ ] | [ ] | [ ] |
| The brand accurately manages orders across channels. | [ ] | [ ] | [ ] | [ ] | [ ] |
| Returns Management Efficiency | [ ] | [ ] | [ ] | [ ] | [ ] |
| Returning products is easy, regardless of the purchase channel. | [ ] | [ ] | [ ] | [ ] | [ ] |
| The return process was quick and convenient. | [ ] | [ ] | [ ] | [ ] | [ ] |
| Refunds and exchanges are handled efficiently. | [ ] | [ ] | [ ] | [ ] | [ ] |
| Customer Loyalty | [ ] | [ ] | [ ] | [ ] | [ ] |
| Attitudinal Loyalty | [ ] | [ ] | [ ] | [ ] | [ ] |
| I have a strong preference for this brand compared to other beauty brands. | [ ] | [ ] | [ ] | [ ] | [ ] |
| I consider this brand to be my first choice for purchasing beauty products. | [ ] | [ ] | [ ] | [ ] | [ ] |
| I feel a sense of attachment to this brand. | [ ] | [ ] | [ ] | [ ] | [ ] |
| Behavioural Loyalty | [ ] | [ ] | [ ] | [ ] | [ ] |
| I intend to continue purchasing this brand in the future. | [ ] | [ ] | [ ] | [ ] | [ ] |
| I frequently purchase products from this brand. | [ ] | [ ] | [ ] | [ ] | [ ] |
| I would recommend this brand to others. | [ ] | [ ] | [ ] | [ ] | [ ] |
| I would continue to buy from this brand even if other brands offer similar products. | [ ] | [ ] | [ ] | [ ] | [ ] |
| Perceived Supply Chain Transparency | [ ] | [ ] | [ ] | [ ] | [ ] |
| This brand openly shares information about its products and sourcing practices with its customers. | [ ] | [ ] | [ ] | [ ] | [ ] |
| This brand provides clear and understandable information about how its products are manufactured and delivered. | [ ] | [ ] | [ ] | [ ] | [ ] |
| I can easily obtain relevant information about this brand’s supply chain activity. | [ ] | [ ] | [ ] | [ ] | [ ] |
| This brand is transparent about its operational and logistical processes. | [ ] | [ ] | [ ] | [ ] | [ ] |
| This brand provides sufficient information to evaluate its supply chain practices. | [ ] | [ ] | [ ] | [ ] | [ ] |
| Perceived Greenwashing | [ ] | [ ] | [ ] | [ ] | [ ] |
| This brand exaggerates the environmental benefits of its products and services. | [ ] | [ ] | [ ] | [ ] | [ ] |
| The brand’s environmental claims were misleading. | [ ] | [ ] | [ ] | [ ] | [ ] |
| This brand presents itself as more environmentally responsible than it actually is. | [ ] | [ ] | [ ] | [ ] | [ ] |
| The brand provides insufficient evidence to support its environmental assertion. | [ ] | [ ] | [ ] | [ ] | [ ] |
| The brand’s environmental claims appear to be exaggerated or unsubstantiated. | [ ] | [ ] | [ ] | [ ] | [ ] |
| The brand uses environmental claims to create a greener image than its actual environmental practices. | [ ] | [ ] | [ ] | [ ] | [ ] |
Appendix B: Measurement Instrument Summary
| Construct | Conceptual Source | Adaptation | Sample Items |
| Delivery Service Quality | Marchet et al. (2018) | Customer-level items were adapted from the delivery-service dimensions discussed by Marchet et al. (2018) to capture customers’ perceptions of delivery performance in sustainable beauty retailing. | “The brand delivers my orders on time.” “The products arrive in good condition.” “The brand provides reliable delivery services.” |
| Channel Integration | Marchet et al. (2018) | Customer-level items were adapted by the authors from the omnichannel distribution and integration dimensions discussed by Marchet et al. (2018) to capture the perceived coordination between the focal brand’s online and offline channels. | “Information is consistent across online and offline channels.” “I can switch easily between channels during my purchase. |
| Fulfilment Process Efficiency | Marchet et al. (2018) | Customer-level items were adapted by the authors from the fulfilment-related logistics dimensions discussed by Marchet et al. (2018) to capture customers’ perceptions of fulfilment responsiveness and operational efficiency. | “Orders are processed efficiently.” “The fulfilment process is smooth and well organised. |
| Returns Management Efficiency | Marchet et al. (2018) | Customer-level items were adapted from the returns-management dimensions discussed by Marchet et al. (2018) to capture customers’ perceptions of post-purchase return-service efficiency. | “Returning products is easy.” “The brand handles returns efficiently.” |
| Perceived Supply Chain Transparency | Morgan et al. (2023) | Adapted to capture customers’ perceptions of supply chain openness, information accessibility, and visibility in the omnichannel sustainable beauty retail context. | “The brand appears transparent about its supply chain.” “The brand provides sufficient visibility regarding its operations.” |
| Perceived Greenwashing | Tu et al. (2024) | This was modified to reflect customers’ perceptions of exaggerated, misleading, or insufficiently substantiated environmental claims in the sustainable beauty industry. | “The brand exaggerates its environmental claims.” “The brand’s sustainability claims seem misleading.” |
| Customer Loyalty | Saini and Singh (2020) | It was retained as a first-order reflective construct representing both attitudinal and behavioural loyalty. | “I intend to continue purchasing from this brand.” “I would recommend this brand to others.” “This brand would be my first choice.” |
REFERENCES
Avvad, M., Ramanan, T. R., Shafi Keelath, M., & Rijas, B. M. (2026). From multichannel to omnichannel: Measuring channel integration and digital adoption patterns. Journal of Theoretical and Applied Electronic Commerce Research, 21(1), 4.
https://doi.org/10.3390/jtaer21010004
Bromideh, A. A., Srivastava, M. K., PV, R., & Abbasian, E. (2026). Multilevel analysis of the perceived greenwashing across age cohorts. International Journal of Business and Development Studies, 5-33.
https://doi.org/10.22111/ijbds.2026.54570.2323
Choubey, V., Joshi, P., Chakraborty, D., Khare, A., & Appolloni, A. (2025). Signals vs. reality: Consumer responses to green claims in quick commerce. Business Strategy and the Environment, 34(3), 3656–3671.
https://doi.org/10.1002/bse.4165
Cotarelo, M., Fayos, T., Calderón, H., & Mollá, A. (2021). Omni-channel intensity and shopping value as key drivers of customer satisfaction and loyalty. Sustainability, 13(11), 5961.
https://doi.org/10.3390/su13115961
D’Acunto, D., Filieri, R., & Okumus, F. (2025). The Gen Z attitude-behavior gap in sustainability-framed eWOM: A generational cohort theory perspective. International Journal of Hospitality Management, 129, 104194.
https://doi.org/10.1016/j.ijhm.2025.104194
Daou, L., Sayegh, E., Atallah, E., Jabbour Al Maalouf, N., & Sarkis, N. (2025). Greenwashing as a barrier to sustainable marketing: Expectation disconfirmation, confusion, and brand–consumer relationships. Sustainability, 17(22), 9979.
https://doi.org/10.3390/su17229979
Do, A. D., Ta, V. L., Bui, P. T., Do, N. T., Dong, Q. T., & Lam, H. T. (2023). The impact of the quality of logistics services in e-commerce on the satisfaction and loyalty of Generation Z customers. Sustainability, 15(21), 15294.
https://doi.org/10.3390/su152115294
Fan, X., Zhang, J., Yao, Y., & Wei, L. (2024). Social responsibility disclosure format in a supply chain. Omega, 126, 103043.
https://doi.org/10.1016/j.omega.2024.103043
Febriani, A., Sopha, B. M., & Wibisono, M. A. (2025). Dynamic capabilities for omnichannel transformation in MSMEs: A comparative case study of fashion and furniture sectors. Journal of Open Innovation: Technology, Market, and Complexity, 11(1), 100498.
https://doi.org/10.1016/j.joitmc.2025.100498
Gao, W., & Jiang, N. (2025). Enhancing omnichannel customer experience: From a customer journey design perspective. Journal of Theoretical and Applied Electronic Commerce Research, 20(4), 277.
https://doi.org/10.3390/jtaer20040277
Gardner, T. A., Benzie, M., Börner, J., Dawkins, E., Fick, S., Garrett, R., Godar, J., Grimard, A., Lake, S., Larsen, R. K., Mardas, N., McDermott, C. L., Meyfroidt, P., Osbeck, M., Persson, M., Sembres, T., Suavet, C., Strassburg, B., Trevisan, A., West, C., & Wolvekamp, P. (2019). Transparency and sustainability in global commodity supply chains. World Development, 121, 163–177.
https://doi.org/10.1016/j.worlddev.2018.05.025
Hair, J. F., Hult, G. T. M., Ringle, C. M., & Sarstedt, M. (2022). A primer on partial least squares structural equation modeling (PLS-SEM) (3rd ed.). SAGE Publications. Available from: https://www.sagepub.com/shop/buy-a-book/a-primer-on-partial-least-squares-structural-equation-modeling-pls-sem-3-270548
Hoang-Tran, K. N., & Duong, N. H. (2026). From innovation resistance to responsible consumption: Sustainability signals shaping trust and preference in luxury metaverse marketing. Cleaner and Responsible Consumption, 21, 100401.
https://doi.org/10.1016/j.clrc.2026.100401
Khalid, B. (2024). Evaluating customer perspectives on omnichannel shopping satisfaction in the fashion retail sector. Heliyon, 10(16), e36027.
https://doi.org/10.1016/j.heliyon.2024.e36027
Kock, N. (2015). Common method bias in PLS-SEM: A full collinearity assessment approach. International Journal of e-Collaboration, 11(4), 1–10.
https://doi.org/10.4018/ijec.2015100101
Konuk, F. A. (2023). Trustworthy brand signals, price fairness and organic food restaurant brand loyalty. Management Decision, 61(10), 3035–3052.
https://doi.org/10.1108/MD-07-2022-0889
Leung, E. K. H. (2025). Total fulfilment management: Principles, practices and use cases. Transportation Research Part E: Logistics and Transportation Review, 194, 103888.
https://doi.org/10.1016/j.tre.2024.103888
Macchione Saes, M. S., Spers, E. E., Feitosa, E. R. M., Lima, L. M. D., Zamith, G., & Marcovitch, J. (2025). Signaling theory and quality cues: The willingness-to-pay for high and low involvement sustainable attributes. Revista de Gestão, 32(4), 247–266.
https://doi.org/10.1108/REGE-08-2024-0129
Mannheim, K. (1952). The problem of generations. In P. Kecskemeti (Ed.), Essays on the sociology of knowledge (pp. 276–322). Routledge & Kegan Paul. Available from: https://www.routledge.com/x/x/p/book/9780415436489
Marchet, G., Melacini, M., Perotti, S., Rasini, M., & Tappia, E. (2018). Business logistics models in omni-channel: A classification framework and empirical analysis. International Journal of Physical Distribution & Logistics Management, 48(4), 439–464.
https://doi.org/10.1108/IJPDLM-09-2016-0273
Mavlanova, T., Benbunan-Fich, R., & Koufaris, M. (2012). Signaling theory and information asymmetry in online commerce. Information & Management, 49(5), 240–247.
https://doi.org/10.1016/j.im.2012.05.004
Mofokeng, T. E. (2023). Antecedents of trust and customer loyalty in online shopping: The moderating effects of online shopping experience and e-shopping spending. Heliyon, 9(5), e16182.
https://doi.org/10.1016/j.heliyon.2023.e16182
Mohd Dzin, N. H., & Lay, Y. F. (2021). Validity and reliability of adapted self-efficacy scales in Malaysian context using PLS-SEM approach. Education Sciences, 11(11), 676.
https://doi.org/10.3390/educsci11110676
Mollenkopf, D. A., Peinkofer, S. T., & Chu, Y. (2022). Supply chain transparency: Consumer reactions to incongruent signals. Journal of Operations Management, 68(4), 306–327.
https://doi.org/10.1002/joom.1180
Moreno-Menéndez, F. M., Zacarías-Rodríguez, V. E., Zacarías-Vallejos, S. R., González-Prida, V., Torres-Quillatupa, P. E., Romero-Girón, H., Vía y Rada-Vittes, J. F., & Huaynate-Espejo, L. Á. (2025). Enhancing customer quality of experience through omnichannel digital strategies: Evidence from a service environment in an emerging context. Future Internet, 17(6), 240.
https://doi.org/10.3390/fi17060240
Morgan, T. R., Gabler, C. B., & Manhart, P. S. (2023). Supply chain transparency: Theoretical perspectives for future research. The International Journal of Logistics Management, 34(5), 1422–1445.
https://doi.org/10.1108/IJLM-02-2021-0115
Nawaz, R. R., & Wagner, R. (2025). Disclosing transparency: A review of B2B marketing and supply chain research. Industrial Marketing Management, 124, 73–94.
https://doi.org/10.1016/j.indmarman.2024.11.011
Nkuna, K. B., Erasmus, A. C., & Olivier, J. (2024). Millennials’ brand legitimacy judgements amid a global crisis: A deeply rooted affair. Journal of Consumer Behaviour, 23(4), 1701–1719.
https://doi.org/10.1002/cb.2297
Osburg, V. S., Yoganathan, V., McLeay, F., & Diallo, M. F. (2022). (In)compatibilities in sustainable luxury signals. Ecological Economics, 196, 107430.
https://doi.org/10.1016/j.ecolecon.2022.107430
Pandey, A., Dwivedi, A., Moray, R., Divekar, V., Jain, S., & Chennamsetti, S. (2025). Examining the factors influencing the intent usage of digital currencies by Gen Z and Millennials: A UTAUT model approach. In International Conference on Smart Trends for Information Technology and Computer Communications (pp. 221–232). Springer Nature Singapore.
https://doi.org/10.1007/978-981-96-7514-2_18
Paramitha, V., Tan, S. Z., & Lim, W. M. (2025). Undoing greenwashing: The roles of greenwashing severity, consumer forgiveness, growth beliefs and apology sincerity. Journal of Product & Brand Management, 34(4), 433–449.
https://doi.org/10.1108/JPBM-11-2023-4846
Peinkofer, S. T., & Jin, Y. H. (2023). The impact of order fulfillment information disclosure on consequences of deceptive counterfeits. Production and Operations Management, 32(1), 237–260.
https://doi.org/10.1111/poms.13833
Pires, P. B., Perestrelo, B. M., & Santos, J. D. (2025). Unpacking customer experience in online shopping: Effects on satisfaction and loyalty. Journal of Theoretical and Applied Electronic Commerce Research, 20(3), 245.
https://doi.org/10.3390/jtaer20030245
Roohanifar, M., Kuivalainen, O., & Pereira, V. (2025). Exploring and investigating the international marketing communication strategies of British digital SMEs: A signalling theory perspective. International Marketing Review, 42(5), 987–1008.
https://doi.org/10.1108/IMR-11-2024-0459
Ryder, N. B. (1965). The cohort as a concept in the study of social change. American Sociological Review, 30(6), 843–861.
https://doi.org/10.2307/2090964
Saini, S., & Singh, J. (2020). Managing consumer loyalty: An expanded model of consumer experience management and consumer loyalty. International Journal of Asian Business and Information Management, 11(1), 21–47.
https://doi.org/10.4018/IJABIM.2020010102
Sansome, K., Wilkie, D., & Conduit, J. (2024). Beyond information availability: Specifying the dimensions of consumer perceived brand transparency. Journal of Business Research, 170, 114358.
https://doi.org/10.1016/j.jbusres.2023.114358
Sarstedt, M., Ringle, C. M., & Hair, J. F. (2022). Partial least squares structural equation modeling. In C. Homburg, M. Klarmann, & A. Vomberg (Eds.), Handbook of market research (pp. 587–632). Springer.
https://doi.org/10.1007/978-3-319-57413-4_15
Sharma, N., & Dutta, N. (2023). Omnichannel retailing: Exploring future research avenues in retail marketing and distribution management. International Journal of Retail & Distribution Management, 51(7), 894–919.
https://doi.org/10.1108/IJRDM-05-2022-0166
She, G. (2022). The real effects of mandatory nonfinancial disclosure: Evidence from supply chain transparency. The Accounting Review, 97(5), 399–425.
https://doi.org/10.2308/TAR-2020-0178
Sneideriene, A., & Legenzova, R. (2025). Greenwashing prevention in environmental, social, and governance (ESG) disclosures: A bibliometric analysis. Research in International Business and Finance, 74, 102720.
https://doi.org/10.1016/j.ribaf.2024.102720
Sodhi, M. S., & Tang, C. S. (2019). Research opportunities in supply chain transparency. Production and Operations Management, 28(12), 2946–2959.
https://doi.org/10.1111/poms.13115
Suphasomboon, T., & Vassanadumrongdee, S. (2026). Perceived greenwashing and its impact on consumer behavior in the cosmetic industry. Cleaner and Responsible Consumption, 20, 100377.
https://doi.org/10.1016/j.clrc.2025.100377
Tu, J. C., Cui, Y., Liu, L., & Yang, C. (2024). Perceived greenwashing and its impact on the green image of brands. Sustainability, 16(20), 9009.
https://doi.org/10.3390/su16209009
Usakli, A., & Kucukergin, K. G. (2018). Using partial least squares structural equation modeling in hospitality and tourism: Do researchers follow practical guidelines? International Journal of Contemporary Hospitality Management, 30(11), 3462–3512.
https://doi.org/10.1108/IJCHM-11-2017-0753
Wan, X. (2022). Omnichannel distribution to fulfill retail orders. Manufacturing & Service Operations Management, 24(4), 2150–2165.
https://doi.org/10.1287/msom.2022.1104
Wandhe, P. (2024). The new generation: Understanding millennials and Gen Z. SSRN, 1-17.
https://doi.org/10.2139/ssrn.4716585
Wisniewski, R., Kownacki, T., Nowakowska-Krystman, A., Wierzchowska, A., Daniluk, P., & Puwalski, K. (2025). The attitudes of Generation Z women to sustainable development—Aspects of SPET. Sustainability, 17(16), 7261.
https://doi.org/10.3390/su17167261
Yang, S., Zhou, Y., Yao, J., Chen, Y., & Wei, J. (2019). Understanding online review helpfulness in omnichannel retailing. Industrial Management & Data Systems, 119(8), 1565–1580.
https://doi.org/10.1108/IMDS-10-2018-0450
Yumurtacı Hüseyinoğlu, I. Ö. Y., Sorkun, M. F., & Börühan, G. (2018). Revealing the impact of operational logistics service quality on omni-channel capability. Asia Pacific Journal of Marketing and Logistics, 30(5), 1200–1221.
https://doi.org/10.1108/APJML-08-2017-0169
Yusoff, A. S. M., Peng, F. S., Abd Razak, F. Z., & Mustafa, W. A. (2020). Discriminant validity assessment of religious teacher acceptance: The use of HTMT criterion. Journal of Physics: Conference Series, 1529(4), 042045.
https://doi.org/10.1088/1742-6596/1529/4/042045
Zhao, X., Lynch, J. G., Jr., & Chen, Q. (2010). Reconsidering Baron and Kenny: Myths and truths about mediation analysis. Journal of Consumer Research, 37(2), 197–206.
https://doi.org/10.1086/651257
Licensed
© 2026 Copyright by the Authors.
Licensed as an open access article using a CC BY 4.0 license.
Article Contents Author Jiyad Shaikh1, * 1NED University of Engineering and Technology, Karachi, Pakistan Article History: Received: 23 July, 2026
Article Contents Author Saad Ahmad Khan1, * Imran Iqbal2 1Department of Marketing and Supply Chain Management, Iqra University, Karachi, Pakistan
Article Contents Author Raza Hussain Khoso1, * 1Department of Management, Emaan Institute of Management and Sciences (EIMS), Karachi, Pakistan Article
Article Contents Author Rashid Ali Baloch1, * 1Indus University, Karachi, Pakistan Article History: Received: 25 August, 2026 Revised: 07 October,
Article Contents Author Muhammad Jawwad1, * 1NED University of Engineering and Technology, Karachi, Pakistan Article History: Received: 01 September, 2026
Article Contents Author Joseph Kofi Mensah1, * , David Kwashie Garr2 , David Mensah Awadzie3 1Department of Business Administration, Accra