










Article Contents
Article ID: CM2622101026
Views: 647The Role of Process Standardisation on Managerial Perception of Customer Satisfaction in Manufacturing Firms of Malaysia
 DOI:
DOI:
 PDF
PDF
⬇ Downloads: 22
1Department of Management, Hainan University, Haikou, China
Received: 13 April, 2026
Accepted: 27 June, 2026
Revised: 17 June, 2026
Published: 22 July, 2026
Abstract:
Introduction: This study examined how process standardisation can be used to improve the managerial perception of customer satisfaction in Malaysian manufacturing companies in the context of high-low business process automation.
Methods: A primary quantitative methodology was used, with 250 managers, supervisors, and IT professionals surveyed using a 5-point Likert scale questionnaire. PLS-SEM and Multi-Group Analysis (MGA) were applied to analyse the data. The dimensions of Process Standardisation comprised Process Execution, Inputs & Outputs, Collaboration & Communication, Governance, Strategy, and Data.
Results: Each of the six process standardisation dimensions demonstrated significant relationships with managers’ perceptions of customer satisfaction. However, the MGA revealed that only some of these relationships varied significantly between firms with low and high levels of automation, data, inputs, outputs, and strategy. The other standardised process dimensions did not differ significantly between high and low automation levels. Data were found to be the strongest predictors of managerial perceptions of customer satisfaction across both high- and low-automation firms. Data were found to be strongly related to managerial perceptions of customer satisfaction in the overall sample, followed by Collaboration and Communication, Governance, Process Execution, Inputs, and Outputs.
Conclusion: Strategic customer satisfaction in Malaysian manufacturing can be achieved through process standardisation. The focus on data use, administrative levels, and operational consistency, promoted through automation and manager oversight, can enhance competitiveness and quality.
Keywords: Process standardisation, managerial perception of customer satisfaction, Malaysian manufacturing, business process automation, PLS-SEM, total quality management (TQM).
1. INTRODUCTION
The manufacturing industry in Malaysia is considered a key contributor to the country’s economic development, accounting for a significant share of GDP and employing people in the electrical and electronics, automotive parts, and machinery industries (MIDA, 2024). As reported by (Invest Malaysia, 2025), this industry is universally recognised as the backbone of Malaysia’s export-oriented industrialisation policy and is crucial for maintaining a competitive edge in world markets. Nevertheless, operational problems have persisted in Malaysian manufacturing companies, directly influencing customer satisfaction and market performance, as revealed by (PROQC International, 2024).
Although the Malaysian manufacturing industry has economic value, it still faces inefficiencies in processes, quality variations, and low digital adoption rates. Analysis of industries indicate that 80.4% of the manufacturing lines in Malaysia remain semi-automated, and 10% remain fully dependent on manual labour, a factor that, in turn, creates variability in processes and results and makes it quite challenging to ensure that firms can comply with the strict customer demands in terms of quality and reliability, as reported by (Jalaludin et al., 2024; and Karim & Said, 2024). Moreover, (Masod & Zakaria, 2024) argue that the introduction of new Industry 4.0 technology is not uniform among companies and is limited by technical and financial issues, as well as human capital. The issue of legacy systems and outdated software is also a challenge for Malaysian manufacturers, making it difficult to integrate digital tools that can help improve process control and standardise quality levels (Al-Shami, 2023).
As noted by (Hossain et al., 2024), quality management is a topical issue. Low-quality production processes can not only increase defect rates and rework expenses but also ruin brand image and reduce customer loyalty, outcomes that directly impact managerial perceptions of customer satisfaction (Hossain et al., 2025). According to a recent survey by (Yusuf et al., 2023), manufacturing companies must optimise quality assurance measures to increase product reliability, minimise operational waste, and improve customer confidence. The inefficiency in filling skills gaps in the targeted technical sectors contributes to operational gaps, hindering companies from performing standardised operations throughout production and service delivery, as suggested by (Farouk et al., 2023).
Process standardisation, as defined by (Lu et al., 2020), refers to the logical consistency of procedures, quality checkpoints, and performance protocols throughout the entire implementation process. It has been identified worldwide as one of the primary drivers of reduced product quality variability and increased service quality by ensuring continuous improvements. Standardised processes enhance the predictability of outcomes, minimise customer complaints, and ensure more dependable delivery schedules, all of which enhance customer satisfaction, as revealed by (Jaeger & Upadhyay, 2020). It is also easier to adopt automation and digital monitoring through standardisation, thereby increasing responsiveness to customer needs and expectations.
While there are many similarities between process standardisation and TQM, BPM, and Industry 4.0 literature such as (Kerpedzhiev et al., 2021; and Viriyasitavat et al., 2020), little investigation has been conducted on how automation maturity influences the effect of process standardisation on the perceptions of managerial customer satisfaction in emerging manufacturing environments. This study goes beyond the application of established dimensions to Malaysia and contributes to the existing theory by showing that the extent to which the process is standardised depends on the type of operational control that is implicit in the firms themselves. Data governance and system-integrated controls strengthen the reliability of the processes and confidence of managers in the processes of operation in high-automation companies, while low-automation companies obtain the same confidence from supervisory monitoring and procedural discipline, as proposed by (Al-Shami, 2023). Therefore, based on TQM theory, this study attempts to go beyond the uniform standardisation assumption and proposes that the degree of automation is a contextual factor that influences the degree of standardisation used in processes to lead to managerial appraisals of operational reliability and perceived customer satisfaction in manufacturing contexts.
2. LITERATURE REVIEW
2.1. Theoretical Framework
The theoretical basis of this study is based on the Total Quality Management (TQM) principle, which focuses on a systematic method of process control, continuous improvement, and operational consistency to enhance quality and managerial understanding of customer satisfaction. To implement quality enhancement, (Maganga & Taifa, 2023) suggest that process variability be minimised by following the same process. (Psarommatis et al., 2022) stated that process standardisation is one of the foundational aspects of TQM and plays a key role in making the manufacturing environment stable and predictable. (Kanan et al., 2023) also argue that standardised routines enable standardisation of best practices, minimise defects and increase process reliability. Building on this, (Baiyere et al., 2020; and Chiarini, 2020) propose that dimensions such as governance systems, communication processes, strategic alignment, and data coordination implement process standardisation by facilitating process discipline, traceability, responsiveness, and quality control.
The study also contributes to the theory of TQM by placing automation maturity in the context of the standardisation of processes related to managers’ perceptions of customer satisfaction. According to (Abdallah et al., 2021), through standardisation, the inner quality processes are connected with the outcomes related to customers; however, the operational ways vary based on technological integration. Digital controls, integrated data systems, and automated monitoring in high-automation companies reinforce the ability to quickly take corrective measures, coordinate, and trace. In contrast, low-automation companies depend more on staff supervision, on-site verification, and disciplinary procedures to ensure consistency. Therefore, the level of automation affects the “how” and the extent of the effectiveness of standardisation. Theoretically, this view can explain the difference between process standardisation and the managerial perception of customer satisfaction in manufacturing companies with different technological and operational situations.
Process standardisation features in TQM literature as a framework for enhancing quality and customer-related outcomes, but the relationships between various standardisation dimensions and customer satisfaction outcomes are usually seen as identical in all organisational environments. This study takes this angle further by suggesting that process standardisation can be seen as a contextual conditioning factor that affects managerial perceptions of customer satisfaction as a result of the level of automation maturity. The study does not assume that standardisation is similar in all its aspects and dimensions as it applies to operational reliability that would be appropriate on all levels of automation. In highly automated companies, reliability is strengthened by the digital monitoring of the process, embedding information systems into the process, and embedded process controls, while in less automated companies, it is through human coordination, process discipline, and managerial supervision. Therefore, standardisation is not necessarily as effective in all manufacturing settings.
This study did not consider a statistical interaction moderator for automation maturity. In contrast, the factor of automation maturity is viewed as a contextual boundary condition that affects the strength of the relationship between each dimension of process standardisation and managers’ perception of customer satisfaction. In line with this view, this study investigates whether these associations vary according to the degree of automation maturity of companies that integrate them. This has the added benefit of being able to measure structural heterogeneity between organisational settings without assuming direct interaction effects.
Governance, strategy, and data are general organisational capabilities found in the TQM literature, but in this study, they have been conceptualised as process standardisation dimensions, as they are the structures by which the standardisation of procedures is designed, coordinated, monitored, and continually improved. Process standardisation is not only about the documentation of operational processes; it also demands a supporting organisation that guarantees the uniformity of process implementation and control. Governance provides accountability and compliance; strategy helps ensure that the activities linked to the standardisation process are aligned with the organisational goals; joint work and communication ensure coordinated implementation across functions; and data help in monitoring and taking corrective action. Hence, these dimensions are understood as independent dimensions that support and facilitate work with processes for standardisation in the manufacturing context.
Present literature on TQM, such as (Delić et al., 2026), generally supposes that process standardisation operates uniformly within firms and generates comparable outcomes associated with quality, regardless of the organisational context. The current study contributes to this viewpoint by theorising automation maturity as a contextual conditioning dimension which determines the practices of standardisation across firms and leads to managerial confidence in operational reliability. Instead of assuming similar effects within a manufacturing setting, this study argues that the effectiveness of process standardisation relies on the technological environment across which process controls, minoring, and informant flow dimensions are integrated.
2.2. Empirical Review
2.2.1. Process Execution and Customer Satisfaction
Theoretical discussions of process execution in the context of TQM have arisen because the ability to standardise processes is seen as a way to create more uniformity in operations, but at the same time, they can also help to reduce adaptive flexibility. Turnover can be confidence and satisfaction based on disciplined execution, as indicated by (De Ramon et al., 2020), however, excessive rigidity in procedures can limit responsiveness in volatile production environments, as highlighted by (Lepistö et al., 2024). The finding that some firms were more effective at executing the new procedures suggests that the effectiveness of execution is not merely a function of the formalisation of procedures but also a function of the ability of the firms to simultaneously implement control and adaptation monitoring. Methodologically, these past studies are mainly based on management self-reports and a cross-sectional approach, which are limited in allowing model causal interpretation and common method biases (CMB). (Al-Shami, 2023) thus puts forward the idea of feedback oriented as opposed to mechanistic execution systems. These new arguments suggest that the first hypothesis of this study can be formulated as follows:
H1: Process execution is significantly and positively related to the managerial perception of customer satisfaction.
2.2.2. Inputs and Outputs and Customer Satisfaction
The quality of raw materials, information, and resources that enter production and the conformity and reliability of the final products sent to customers are the inputs and outputs. The relationship between input-output control and managerial perception of customer satisfaction remains unclear from a theoretical standpoint in the literature on TQM. While (Zuhaira & Ahmad, 2021) conclude that the standardised input controls have a positive effect on operational reliability and output uniformity, (Al-Shami, 2023) believes that standardised input controls can reduce responsiveness when customers’ requirements differ significantly. This dichotomy suggests that a decrease in defects may not be the only reason managers rate satisfaction as high. (Hossain et al., 2024) also believes that customer-related outcomes are dependent more on the degree of consistency between the organisation’s production standards and the external expectations than on the degree of conformity with production standards. Often, the results of previous research combine an input and an output in a single dimension, thereby masking their different operating and evaluation impacts. Based on the above arguments emerging from the literature, the following hypothesis (H2) is formulated:
H2: Inputs and outputs have a statistically significant positive association with the managerial perception of customer satisfaction.
2.2.3. Collaboration, Communication, and Customer Satisfaction
Collaboration and communication are often considered central dimensions through which TQM improves quality and customer satisfaction, although empirical evidence remains theoretically challenging. In this perspective, (Poornachandrika & Venkatasudhakar, 2020) state that the essence of TQM is cross-functional communication and that quality failures are more frequently coordination-based than technical. In line with this argument, (De Ramon et al., 2020) show that internal collaboration enhances process reliability and improves customer satisfaction. Nevertheless, (Al-Omari et al., 2020) challenge this presumption, arguing that collaboration can undermine customer performance when decision-making is excessively centralised, thereby restricting responsiveness and frontline discretion. Methodologically, most studies focus on internal coordination at the expense of communication with suppliers and customers, thereby limiting their explanatory power. Furthermore, cooperation is often assessed perceptually, making it more vulnerable to social desirability bias. (Chiarini, 2020) also warns that informal communication is inconsistent, should be formalised, and should focus on the process to align with TQM principles. Thus, it becomes clear that “collaboration” and “communication” are theoretically competing concepts in TQM, as the coordination dimension can strengthen integrated processes and simultaneously limit operational responsiveness. While cross-functional cooperation is linked to reliability and managers’ satisfaction ratings, as argued by (De Ramon et al., 2020), centralisation may have a negative impact, as it may diminish frontline discretion and slow down timely corrective actions, as indicated in the analysis of (Al-Omari et al., 2020). This paradox indicates that the effectiveness of communication is influenced by the institutionalisation of the coordination structure within operational systems. According to (Chiarini, 2020), however, coordination is more successful in incremental change than formal communication and is more suitable to go along with the goals of TQM than informal communication. From the methodological point of view, it has been noted that previous studies tend to focus mainly on the coordination of internal operations, while overlooking the dynamics of communication between the suppliers and customers.
H3: Collaboration and communication have a statistically significant positive effect on managers’ perception of customer satisfaction. Governance and Customer Satisfaction.
Governance is defined as a dimension based on policies and practices for overseeing that organisations are complying, accountable, and quality-assuring. The concept of governance is still conceptually discussed in the TQM literature as a tool to enhance accountability and simultaneously decrease the operating flexibility of the organisation. While structured governance enhances quality consistency through consistent governance processes, as (Saxena & McDonagh, 2020) highlighted, it is the effectiveness of governance that undermines it when operational pressures force staff to “short-cut” governance. Standard governance procedures help ensure consistent quality, as (Saxena & McDonagh, 2020) argued. On the other hand, strong governance increases the susceptibility of quality inconsistency when employees feel incentivised to bypass checks and balances in the face of operational pressures, as shown by (Al-Shami, 2023). This disharmony suggests that governance can only help in the managerial perception of customer satisfaction if formal rules are available as part of the ongoing operational routines monitored continuously. (Abdallah et al., 2021) also doubt the usefulness of static notions of governance, which do not capture adaptive process adjustments. There is also a significant reliance on pre-existing evidence that is mainly based on top-management surveys, which may lead to bias in perceptions and overestimation of enforcement. The studies used a methodological approach based on top management surveys, which can introduce bias by overestimating the effectiveness of enforcement. Also, there is the issue of governance being perceived as a static concept, without considering the dynamic adjustments to operations or market changes suggested by (Abdallah et al., 2021). In the context of TQM theory, governance emphasises continuous improvement rather than compliance. Based on these arguments, the following hypothesis (H4) is developed:
H4: Governance has a statistically significant and positive relationship with the managerial perception of customer satisfaction.
2.2.4. Strategy and Customer Satisfaction
Strategy is the process of long-term planning, prioritisation, and resource allocation that defines an organisation’s direction and competitive position. The strategic side of TQM is also varied and controversial because, although there are established quality strategies in place, it does not necessarily imply that the strategies are being put into practice. In contrast, strategic alignment is linked to improvement in customer outcomes as asserted by (Torlak et al., 2020; Uzoka et al., 2024), while strategic misalignment in operational execution is linked to less effective processes as stated by (Teeroovengadum, 2023). The paradox suggests that strategy has an impact on satisfaction only if it is implemented as measurable operational actions and not as a symbolic commitment of the managers. From a methodological perspective, previous research has relied predominantly on strategic alignment self-reported measures, which do not fully reflect the degree of execution and integration of the operational process. Therefore, they lack an in-depth understanding of the link between strategy and performance in manufacturing settings. Although an empirical investigation of Malaysian manufacturing industries can be conducted, emerging arguments from the studies have led to the following H5:
H5: Strategy is significantly and positively associated with managerial perception of customer satisfaction.
2.2.5. Data and Customer Satisfaction
Data are the collection, handling, and use of operational and customer-related information that leads to process improvements and decision-making. (Rane, 2023) showed that companies that use precise production and quality data can minimise defects, forecast customer requirements, and plan deliveries to enhance customer satisfaction. Conversely, (Hamoud et al., 2020) caution that an ineffective decision is made due to poor data governance or an inadequate information system that disrupts the standardisation process and erodes customer trust. In the TQM value chain, operational data are regularly collected, monitored, and analysed, which supports continuous improvement and enables companies to respond proactively to customer complaints and maintain consistent quality, as (Baiyere et al., 2020) suggested. As observed in the case of Malaysian manufacturing companies, where data integration is uneven, data practices are being improved to increase reliability, responsiveness, and overall perceived customer satisfaction. Based on these arguments, the following hypotheses are proposed. The conceptual framework of the hypothesised relationship is shown in Fig. (1).
H6: Data is statistically significantly and positively related to the managerial perception of customer satisfaction.
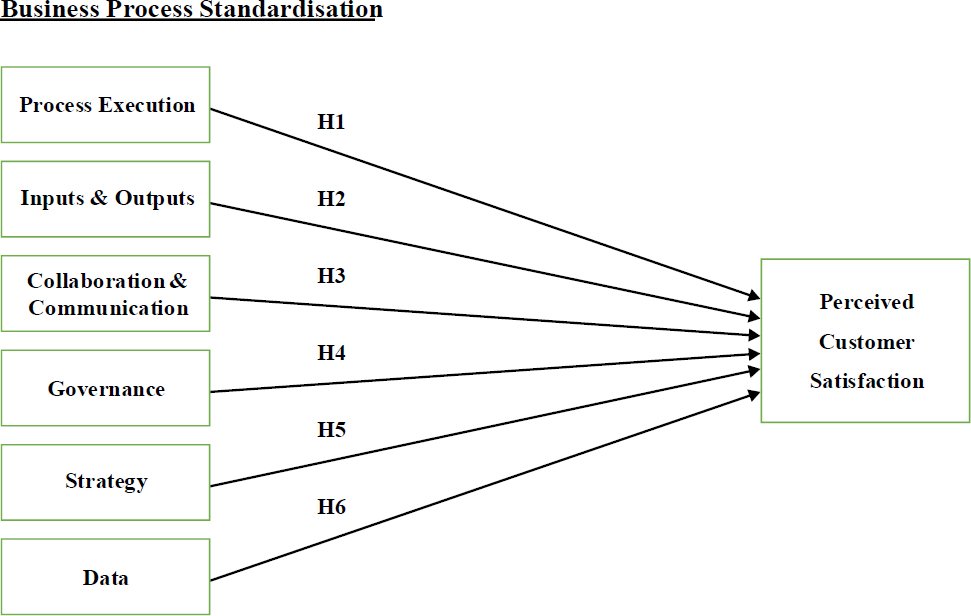
Fig. (1). Conceptual framework.
3. METHODOLOGY
The proposed study is based on a primary research design that employs a quantitative approach, utilising Structural Equation Modelling with Multi-Group Analysis to investigate the relationship between process standardisation and customer satisfaction among manufacturing companies. This study assessed both the correlational and predictive relationships between the variables. The constructs are loosely connected with the TQM model, but the main aim is to examine the predictive relationship between process standardisation mechanisms and the managerial perception of customer satisfaction. Hence, the hypotheses were formulated and examined using PLS-SEM to determine the strength and significance of the hypothesised relationships. Data were gathered using a structured questionnaire on a five-point Likert scale (Appendix A). This method is well suited for capturing managers’ views and for evaluating structural equation models (SEM), as also proposed by (Lionello et al., 2021). The questionnaire, as depicted in the Appendix, conceptualised seven dimensions: process execution, process inputs and outputs, Collaboration and Communication, Governance, Strategy, Data, and managerial perception of customer satisfaction. In addition, the dependent variable, perceived customer satisfaction, is conceptualised as a unidimensional managerial evaluation construct. The measurement items of the questionnaire associated with the dimensions of process standardisation were adopted from (Wurm et al., 2018). In addition, the measurement items or sub-dimensions of perceived customer satisfaction were adapted from (Ribbink et al., 2004). The items are comprised of “Our customers are generally pleased with the consistency and reliability of the products delivered by our company”. “Our customers are satisfied with our products as they meet their quality expectations due to well-controlled and standardised operational processes”. “Our customers enjoy using our products, produced through standardised manufacturing process”.
The classification of firms into low- and high-automation groups was carried out according to their average automation scores on a 5-point scale for digital integration, system coordination, automated workflows, and real-time information use, as developed by (Atieh et al., 2025). Multi-group analysis (MGA) is conducted using a median-based threshold to classify firms into high and low automation groups (125 firms each). Scores that fell near the median cut-off were categorised to have a balanced number of scores within each score category and help facilitate meaningful comparison across groups. No changes were made to the response values, automation scores, or original observations during this process.
A sample of 250 respondents, consisting of Malaysian manufacturing companies, was selected, and 125 respondents each in the sample represented high and low business process automation firms. Renowned firms such as Top Glove Corporation, Hartalega Holdings, Petronas Chemicals Group, Nestlé Malaysia, Vitrox Corporation, and Inari Amertron were approached. The respondents were department heads, production managers, supervisors, and IT experts with first-hand knowledge of the operations process. As suggested by (Shamsudin et al., 2024), purposive sampling was used in this study because of the specific emphasis on respondents who possess certain functional expertise that applies to the manufacturing operations. Information-rich respondents are essential for assessing managerial perceptions of customer satisfaction in low- and high-automation environments.
This sampling approach has the potential to include business entities that engage digitally and have professional links or networks at higher rates than common business entities, thus causing distortions in the perceived evaluations of Digital Manufacturing’s overall processes. The survey respondents are likely familiar with the processes and tools used digitally, which affects their ability to provide an accurate representation of process implementation, supply chain performance, and customer satisfaction. Ultimately, the results do not adequately characterise all samples in the broad manufacturing sector that have low levels of digital adoption and/or low levels of connectivity among management personnel. The z-probability formula was used in estimating the sample size, and the formula takes into account the confidence level, population variance, and margin of error.
n = (Z × Z × p × (1 − p)) ÷ (e × e)
n = (1.96 × 1.96 × 0.50 × 0.50) ÷ (0.06 × 0.06)
n = (3.8416 × 0.25) ÷ 0.0036
n = 0.9604 ÷ 0.0036
n = 266.78, rounding to 267 final participants).
A total of 267 questionnaires were returned out of 500, with a response rate of approximately 53.2%. After screening for missing values and multicollinearity, 17 responses were excluded, and 250 respondents were included in the analysis. A combination of professional platforms, such as LinkedIn, and the official social media pages of manufacturing companies was used to approach the participants, which guaranteed targeted access. After data screening, 250 valid questionnaires were retained for analysis. To facilitate multi-group analysis (MGA), a median split was performed based on the average automation scores, creating two statistically comparable groups of equal size (n = 125 each for low and high automation groups).
As manufacturing companies are spread throughout various regions of Malaysia, data collection was performed through an online survey, as it was easier and less resource-consuming to undertake. The approach also made it easier to access managerial respondents, who are more difficult to reach by conventional means because of their work duties. In addition, online administration proved to be more cost-effective and quicker for data collection, while allowing a broader reach of organisations. In addition, the online survey approach also allowed access to geographically dispersed participants in Malaysia, enhancing managerial accessibility within less time and cost consumption. Such benefits ensured that the method was suitable for the data collected from manufacturing managers with limited resources and time for research.
Despite the fact that the participants under study were recruited mostly through LinkedIn and official social media platforms, they oversampled employees working in more urban areas or less digitally mature firms. To reduce the possibility of bias, purposive sampling was used to ensure that there were participants in high- and low-automation firms in different regions. To control selection bias, both automation groups were subjected to the same screening parameters. The test for non-response bias was conducted using a t-test (independent samples) between early (n = 30) and late respondents (n = 30), as suggested by (Nwosu et al., 2024), and no significant differences were found.
Procedural and statistical cures were applied to assess common method bias. Procedurally, the anonymity of respondents was guaranteed, and the wording of items was revised to minimise ambiguity, as recommended by (Shamsudin et al., 2024). The single-factor test by Harman showed that no factor explained the majority of the variance. Furthermore, full collinearity VIF was also analysed to address the CMB, against the threshold value of 3.3, suggested by (Castillo et al., 2026). As observed in Table 1, the values of VIF are lower than the standard threshold of 3.3, indicating that there is no issue of CMB in the measurement model.
Table 1. Full-collinearity VIF.
| – | Complete | High Automation | Low Automation |
| Construct | VIF | VIF | VIF |
| Collaboration & Communication -> Perceived Customer Satisfaction | 2.062 | 2.563 | 1.826 |
| Data -> Perceived Customer Satisfaction | 1.275 | 1.180 | 2.121 |
| Governance -> Perceived Customer Satisfaction | 1.874 | 1.740 | 2.190 |
| Inputs & Outputs -> Perceived Customer Satisfaction | 1.298 | 1.310 | 1.315 |
| Process Execution -> Perceived Customer Satisfaction | 1.795 | 2.041 | 1.656 |
| Strategy -> Perceived Customer Satisfaction | 2.141 | 1.148 | 2.492 |
Data were analysed using Partial Least Squares Structural Equation Modelling (PLS-SEM) with Multi-Group Analysis, which is appropriate for making predictions in a study and comparing groups, as recommended by (Perez et al., 2024). The measurement model was assessed to examine internal consistency reliability in terms of Cronbach’s alpha and composite reliability, and convergent validity in terms of average variance extracted. As reflected by (Hair et al., 2025), PLS-SEM was chosen over covariance-based SEM because it was best suited for testing a theory. However, as the study is mainly prediction-oriented, it was used to explain the variance in the managerial perception of customer satisfaction instead of confirming a strictly established theoretical model. It is conceptualised as a one-dimensional managerial assessment dimension which imitates the overall evaluation of managers of customer satisfaction instead of a multidimensional operational performance index. The model is structurally complex, comprising multiple interrelated dimensions and multiple group analyses between high- and low-automation firms, which can be analysed better by PLS-SEM than by CB-SEM. Moreover, the data were based on survey-based Likert responses, which might not be normally distributed in the multivariate sense, leading to the use of variance-based SEM. As a result, it met the methodological and predictive criteria of the study.
This was followed by structural path analysis to verify the hypothesised causal relationships among the process standardisation dimensions and the managerial perception of customer satisfaction. The measurement invariance of the Composite Models procedure was used to perform a multi-group analysis to determine the differences between the high and low automation groups. It is an effective method of analysis that allows for the comparison of structural relationships and considers the measurement equivalence that enhances the validity and interpretation of results.
4. RESULTS
4.1. Demographics Analysis
The results specified in Table 2 show the demographic classification of the study participants in a total sample of (n=250). The results show that among the participants, 70% were male and 30% were female. The maximum, that is 30% and 32%, fell in the age brackets of 26-35 years and 46-55 years, while 24% were 36-45 years. Among the participants, 40% were managers, 36% were supervisors, and 24% were department heads. In addition, 44% represented the production department, 24% the quality check department, and 32% the IT department of the manufacturing companies. In terms of the extent of automation in the manufacturing process, 50% reported low automation and 50% reported high automation. In terms of the mode of information sharing related to inputs and outputs, 24% reported the use of emails and manual spreadsheets, 40% reported integrated digital systems, and 36% reported real-time system integration. Lastly, regarding the level of system-based automated data capturing in production operations, 28% reported that data was captured at selected stages, 32% reported that data was captured across most processes, and 40% reported using fully system-generated data.
Table 2. Demographics analysis.
| Demographic Category | Frequency (n) | Percentage (%) | |
| Gender | Male | 175 | 70.00% |
| Female | 75 | 30.00% | |
| Age Range | 18-25 | 35 | 14.00% |
| 26-35 | 75 | 30.00% | |
| 36-45 | 60 | 24.00% | |
| 46-55 | 80 | 32.00% | |
| Job Title/Position | Manager | 100 | 40.00% |
| Supervisor | 90 | 36.00% | |
| Department Head | 60 | 24.00% | |
| Department | Production | 110 | 44.00% |
| Quality | 60 | 24.00% | |
| IT | 80 | 32.00% | |
| Perceived Level of Automation | High Automation | 125 | 50.00% |
| Low Automation | 125 | 50.00% | |
| Primary mode of information sharing across departments | Email and spreadsheets | 60 | 24.00% |
| Integrated digital systems | 100 | 40.00% | |
| Real-time system integration | 90 | 36.00% | |
| Level of system-based data capture in production and operations | Captured at selected stages | 70 | 28.00% |
| Captured across most processes | 80 | 32.00% | |
| Fully system-generated data | 100 | 40.00% | |
4.2. Descriptive Statistics Analysis
Table 3 presents the descriptive data for the study variables. The managers’ average scores were highest for Data (Mean = 3.737, SD = 0.738) and Strategy (Mean = 3.737, SD = 0.800), indicating a good level of consensus on the presence of these practices. The mean of Perceived Customer Satisfaction was also relatively high (Mean = 3.731, SD = 0.676), indicating that managers rated the satisfaction of the customers favourably. Governance reported a mean of (Mean = 3.576, SD = 0.842), followed by Collaboration and Communication (Mean = 3.377, SD = 0.917) and Process Execution (Mean = 3.352, SD = 0.933). Inputs and Outputs recorded the lowest mean (Mean = 3.333, SD = 0.814). The standard deviation values were moderate, indicating moderate consistency between the responses of the sampled companies.
Table 3. Descriptive statistics.
| Descriptive Statistics | |||
| – | N | Mean | Std. Deviation |
| Process Execution | 250 | 3.352 | 0.933 |
| Inputs and Output | 250 | 3.333 | 0.814 |
| Collaboration & Communication | 250 | 3.377 | 0.917 |
| Governance | 250 | 3.576 | 0.842 |
| Strategy | 250 | 3.737 | 0.800 |
| Data | 250 | 3.737 | 0.738 |
| Perceived Customer Satisfaction | 250 | 3.731 | 0.676 |
4.3. Measurement Model Analysis
The measurement model of the study was examined by applying measurement model approaches, which consisted of Cronbach’s Alpha, Composite Reliability, and Average Variance Extracted (AVE). The results are presented in Table 4.
Table 4. Measurement model.
| – | High Automation | Low Automation | Overall | |||||||
| Latent Variables | Indicators | Factor Loadings | Cronbach’s Alpha | Average Variance Extracted (AVE) | Factor Loadings | Cronbach’s Alpha | Average Variance Extracted (AVE) | Factor Loadings | Cronbach’s Alpha | Average Variance Extracted (AVE) |
| Collaboration & Communication | CC1 | 0.831 | 0.877 | 0.798 | 0.895 | 0.878 | 0.803 | 0.873 | 0.880 | 0.807 |
| CC2 | 0.928 | 0.911 | 0.921 | |||||||
| CC3 | 0.919 | 0.882 | 0.899 | |||||||
| Data | D1 | 0.861 | 0.894 | 0.826 | 0.844 | 0.826 | 0.741 | 0.853 | 0.863 | 0.785 |
| D2 | 0.944 | 0.876 | 0.913 | |||||||
| D3 | 0.920 | 0.863 | 0.891 | |||||||
| Governance | G1 | 0.934 | 0.924 | 0.866 | 0.909 | 0.897 | 0.830 | 0.921 | 0.910 | 0.847 |
| G2 | 0.948 | 0.938 | 0.942 | |||||||
| G3 | 0.910 | 0.885 | 0.897 | |||||||
| Inputs and Outputs | IO1 | 0.818 | 0.707 | 0.632 | 0.881 | 0.846 | 0.763 | 0.854 | 0.800 | 0.713 |
| IO2 | 0.880 | 0.905 | 0.899 | |||||||
| IO3 | 0.672 | 0.833 | 0.775 | |||||||
| Managerial perception of customer satisfaction | PCS1 | 0.885 | 0.737 | 0.655 | 0.872 | 0.69 | 0.616 | 0.885 | 0.711 | 0.631 |
| PCS2 | 0.896 | 0.694 | 0.776 | |||||||
| PCS3 | 0.857 | 0.778 | 0.713 | |||||||
| Process Execution | PE1 | 0.654 | 0.764 | 0.679 | 0.851 | 0.86 | 0.779 | 0.859 | 0.822 | 0.736 |
| PE2 | 0.861 | 0.885 | 0.861 | |||||||
| PE3 | 0.854 | 0.912 | 0.854 | |||||||
| Strategy | S1 | 0.914 | 0.921 | 0.863 | 0.896 | 0.885 | 0.813 | 0.901 | 0.902 | 0.836 |
| S2 | 0.953 | 0.922 | 0.939 | |||||||
| S3 | 0.920 | 0.887 | 0.903 | |||||||
The results of the measurement model indicate a satisfactory level of reliability and convergent validity for high automation, low automation, and the overall sample (Table 4). In Collaboration and Communication, the factor loadings were above the recommended factor loading of 0.70 in all groups, with a range of 0.831 to 0.928, a Cronbach’s alpha of over 0.87, and an AVE of over 0.79, indicating excellent internal consistency. The Data dimension recorded high loadings between 0.844 and 0.944 and a satisfactory reliability, but the comparison of the AVE values of the low automation group was relatively lower, indicating weak but tolerable convergence. Governance presented a high level of measurement within groups, with loadings above 0.90 and an AVE of more than 0.83. Moderate reliability scores were observed in the high automation group in the report of inputs and outputs, as they showed marginal loadings of less than 0.70, but overall reliability and AVE were acceptable. Process Execution shows variation among the groups, where weaker convergence is observed in high-automation firms and stronger convergence in low-automation firms. Strategy was a consistent dimension with large loadings, reliability, and AVE in all samples. In general, the measurement model met the criteria of reliability and validity and can be considered appropriate for structural analyses. The indicators PE1 (0.654) and IO3 (0.672) were retained for further use in the exploratory and early stages of developing the model using PLS-SEM because their loadings were higher than the minimum requirement of 0.60. They should be retained because of their theoretical importance, and previous studies, including (Chou & Lin,. 2023), have argued that variables with validity of 0.6 or higher need to be retained to maintain content validity. Furthermore, composite reliability and AVE values were satisfactory, even with lower item loadings, with all being above the recommended levels, suggesting that the scales had good internal consistency and convergent validity.
4.4. Discriminant Validity Analysis
The discriminant validity assessment using the HTMT ratio allows for the analysis of the dimensions’ separability and distinctness along conceptual overlapping by analysing a threshold value of 0.85. The results are presented in Table 5.
Table 5. Discriminant validity.
| Category | Collaboration & Communication | Data | Governance | Inputs & Outputs | Managerial Perception of Customer Satisfaction | Process Execution |
| High Automation | – | – | – | – | – | – |
| Data | 0.443 | – | – | – | – | – |
| Governance | 0.641 | 0.428 | – | – | – | – |
| Inputs & Outputs | 0.311 | 0.48 | 0.263 | – | – | – |
| Managerial perception of customer satisfaction | 0.419 | 0.643 | 0.457 | 0.596 | – | – |
| Process Execution | 0.645 | 0.242 | 0.544 | 0.472 | 0.252 | – |
| Strategy | 0.48 | 0.646 | 0.437 | 0.416 | 0.642 | 0.275 |
| Low Automation | – | – | – | – | – | – |
| Data | 0.524 | – | – | – | – | |
| Governance | 0.647 | 0.61 | – | – | – | – |
| Inputs & Outputs | 0.448 | 0.294 | 0.468 | – | – | – |
| Managerial perception of customer satisfaction | 0.64 | 0.644 | 0.648 | 0.369 | – | – |
| Process Execution | 0.557 | 0.315 | 0.634 | 0.512 | 0.404 | – |
| Strategy | 0.436 | 0.649 | 0.466 | 0.196 | 0.643 | 0.173 |
| Overall | – | – | – | – | – | – |
| Data | 0.475 | – | – | – | – | – |
| Governance | 0.652 | 0.508 | – | – | – | – |
| Inputs & Outputs | 0.414 | 0.365 | 0.378 | – | – | – |
| Managerial perception of customer satisfaction | 0.541 | 0.653 | 0.582 | 0.453 | – | – |
| Process Execution | 0.654 | 0.274 | 0.59 | 0.531 | 0.323 | – |
| Strategy | 0.458 | 0.655 | 0.45 | 0.285 | 0.651 | 0.22 |
The HTMT results in Table 5 were analysed to evaluate the discriminant validity of the high-automation, low-automation, and general samples. A substantial part of the HTMT values fell below the conservative level of 0.85, which means that the dimensions are conceptually different and can be separated. Most of the dimension pairs within the high-automation group indicated acceptable discriminant validity; for instance, the value of HTMT between Data and Managerial perception of customer satisfaction lies below the threshold, indicating no conceptual overlap in the highly automated environment. Furthermore, within the low automation and overall segments, the HTMT values were also lower than the threshold of 0.85, which establishes discriminant validity with no conceptual overlap. Overall, the HTMT findings show that discriminant validity is achieved, and the measurement model has shown that dimension distinctiveness is acceptable, which in turn evidences the appropriateness of the model in future structural models and multi-group analyses.
4.5. Path Coefficient Analysis
The path analysis outcomes (Table 6) show a high degree of relationship between all the process standardisation dimensions on one hand and managerial perception of customer satisfaction in both high and low automation groups, as well as the overall sample.
Table 6. Path coefficient.
| High Automation | Path coefficients | T statistics | P values | F-square |
| Collaboration & Communication -> Managerial perception of customer satisfaction | 0.215** | 2.451 | 0.014 | 0.003 |
| Data -> Managerial perception of customer satisfaction | 0.461*** | 5.905 | 0.001 | 0.392 |
| Governance -> Managerial perception of customer satisfaction | 0.188** | 2.124 | 0.034 | 0.018 |
| Inputs & Outputs -> Managerial perception of customer satisfaction | 0.145** | 2.419 | 0.016 | 0.018 |
| Process Execution -> Managerial perception of customer satisfaction | 0.162** | 2.055 | 0.040 | 0.002 |
| Strategy -> Managerial perception of customer satisfaction | 0.230*** | 2.842 | 0.005 | 0.021 |
| Low Automation | ||||
| Collaboration & Communication -> Managerial perception of customer satisfaction | 0.132** | 1.992 | 0.046 | 0.001 |
| Data -> Managerial perception of customer satisfaction | 0.460*** | 4.983 | 0.001 | 0.561 |
| Governance -> Managerial perception of customer satisfaction | 0.135** | 2.015 | 0.044 | 0.014 |
| Inputs & Outputs -> Managerial perception of customer satisfaction | 0.204** | 2.561 | 0.010 | 0.066 |
| Process Execution -> Managerial perception of customer satisfaction | 0.177*** | 2.234 | 0.025 | 0.012 |
| Strategy -> Managerial perception of customer satisfaction | 0.225** | 2.557 | 0.011 | 0.001 |
| Overall | ||||
| Collaboration & Communication -> Managerial perception of customer satisfaction | 0.155** | 2.108 | 0.035 | 0.029 |
| Data -> Managerial perception of customer satisfaction | 0.465*** | 8.633 | 0.001 | 0.229 |
| Governance -> Managerial perception of customer satisfaction | 0.101** | 2.186 | 0.029 | 0.025 |
| Inputs & Outputs -> Managerial perception of customer satisfaction | 0.083** | 1.987 | 0.047 | 0.000 |
| Process Execution -> Managerial perception of customer satisfaction | 0.142** | 2.012 | 0.044 | 0.002 |
| Strategy -> Managerial perception of customer satisfaction | 0.141** | 1.988 | 0.047 | 0.061 |
Note: **shows Significance at 5%; *** shows Significance at 1%
In the high automation group, Data (β = 0.461, p < 0.001) was strongly related to managerial perception of customer satisfaction, followed by Strategy (β = 0.230, p = 0.005), Collaboration and Communication (β = 0.215, p = 0.014), Governance (β = 0.188, p = 0.034), Process Execution (β = 0.162, p = 0.040), and Inputs and Output Data also showed a significant relationship (β = 0.460, p < 0.001) with Strategy (β = 0.225, p = 0.011).
For the low-automation group, all paths were found to be statistically significant, implying that all dimensions of standardisation in processes have a positive association with managerial perceptions of customer satisfaction. The strongest relationship was found for Data, where β = 0.460, p < 0.001, followed by Inputs & Outputs, where β = 0.204, p = 0.010, and Strategy, where β = 0.225, p = 0.011. Collaboration and Communication, Governance, and Process Execution were found to have a significant positive relationship with customer satisfaction (p < 0.05), which indicates that despite lower levels of technological integration, managers still rate standardisation, control, and coordination as critical to operational consistency.
Overall, Data held the strongest relationship (β = 0.465, p < 0.001), while Collaboration and Communication (β = 0.155, p = 0.035), Governance (β = 0.101, p = 0.029), Process Execution (β = 0.142, p = 0.044), Strategy (β = 0.141, p = 0.047), and Inputs also observed a significant association with the managerial perception of customer satisfaction. The combination of these results suggests that process standardisation dimensions have a substantial relationship with the managerial perception of customer satisfaction with data, being the most influential in all automation levels, which is truly important in providing customer-focused outcomes in Malaysian manufacturing scenarios.
Lastly, with regard to Cohen’s effect size guidelines (small effect ≈ 0.02, medium effect ≈ 0.15, large effect ≈ 0.35), there are clear differences between dimensions and automation levels. In high-automation firms, the small effects of the other dimensions (Collaboration, Governance, Inputs & Outputs, Process Execution, Strategy) are not significantly different from each other, except for data, which shows a large effect (f² = 0.392), suggesting that this is not significantly different from any of the other dimensions. In low-automation firms, data have a large effect (f² = 0.561), indicating even further overall dominance, whereas Inputs & Outputs have a small-to-moderate effect (f² = 0.066), and all other variables have negligible effects (<0.014). In the overall model, data had a medium effect (f² = 0.229), thus reinforcing its core explanatory role in the context. Small effects were shown by Strategy (f2 = 0.061) and Inputs & Outputs, and minimal effects were shown by Governance, Process Execution, and Collaboration.
4.6. Model Fitness Analysis
The model-fit indices in Table 7 suggest a reasonable overall model fit for all groups. All SRMR values were below 0.08, which is the cutoff for a good fit for the overall (0.058), high-automation (0.069), and low automation (0.071) models. The d_ULS and d_G values exhibited consistent differences between the saturated and estimated models, with no significant misfits. The chi-square values are quite high in all models, which is not surprising in large-sample studies and does not imply poor model fit in PLS-SEM. The model showed good predictive and structural fit in both automation groups.
Table 7. Model fitness.
| Overall Model | High-Automation | Low Automation | ||||
| – | Saturated Model | Estimated Model | Saturated Model | Estimated Model | Saturated Model | Estimated Model |
| SRMR | 0.058 | 0.058 | 0.069 | 0.069 | 0.071 | 0.071 |
| d_ULS | 0.777 | 0.777 | 1.097 | 1.097 | 1.173 | 1.173 |
| d_G | 0.507 | 0.507 | 0.866 | 0.866 | 0.677 | 0.677 |
| Chi-square | 754.340 | 754.340 | 466.618 | 466.618 | 605.732 | 605.732 |
| NFI | 0.801 | 0.801 | 0.738 | 0.738 | 0.740 | 0.740 |
4.7. Model Explanatory Power Analysis
The model’s explanatory power can be explained by the R-square and Adjusted R-square values, which are helpful in examining the predictive power or the level of variance in the dependent variable predicted by the independent dimensions. The results are presented in Table 8.
Table 8. Model explanatory power.
| High Automation | R-Square | R-Square Adjusted |
| Managerial perception of customer satisfaction | 0.757 | 0.741 |
| Low Automation | ||
| Managerial perception of customer satisfaction | 0.668 | 0.654 |
| Overall | ||
| Managerial perception of customer satisfaction | 0.700 | 0.692 |
From the results specified in Table 8, it can be observed that in the case of high automation, 75.7% variance in managerial perception of customer satisfaction can be predicted by business process standardisation, in the case of low automation environment the predictive power is reduced to 66.8% and in overall environment 70% variance in managerial perception of customer satisfaction can be predicted by business process standardisation dimensions.
4.8. Predictive Relevance Analysis
The Q²predict value of 0.684 (Table 9) is considerably higher than zero, which shows the robust predictive relevance of the structural model for managerial perception of customer satisfaction. In addition, the comparatively low RMSE (0.570) and MAE (0.423) values signify satisfactory accuracy of prediction, which also indicates that the model holds significant out-of-sample predictive capability as well as practical usefulness. The comparatively high Q²predict value is attributed to the robust explanatory power of the process standardisation dimensions, specifically practices related to data which showed a significantly predictive relationship. This demonstrates that managerial perceptions of customer satisfaction hold a robust association with standardised operational processes.
Table 9. Predictive relevance.
| – | Q²predict | RMSE | MAE |
| Perceived Customer Satisfaction | 0.684 | 0.570 | 0.423 |
4.9. MICOM Analysis
Both groups prompted by identical indicators, paths, and data treatment procedures established Configural Invariance. The results in Table 10 from all three dimensions show that the compositions are invariant within the high- and low-automation groups (P > 0.05), suggesting consistency in the measurement of the dimensions across groups. Step 3 results, however, suggest that the means are the only measures where there is partial measurement invariance, as variance differences were found for Collaboration & Communication, Data, Perceived Customer Satisfaction, and Strategy (p < 0.05). Dimensions seem to be equally measured across groups but are differently distributed, indicating that there are real structural differences between automation contexts. Importantly, the finding of compositional invariance and partial scalar invariance affords sufficient statistical support for using multi-group analysis (MGA), so that the observed group differences in path coefficients are not attributable to measurement error but are reflective of genuine structural differences.
Table 10. MICOM.
| Step | Dimension | Test | Statistic | p-value | Interpretation |
| Step 2 | All dimensions | Compositional invariance | r ≈ 0.996–1.000 | >0.05 | Supported |
| Step 3a | Collaboration & Communication | Equality of means | -0.329 | 0.013 | Not equal |
| Inputs & Outputs | Equality of means | -0.517 | 0.000 | Not equal | |
| Process Execution | Equality of means | -0.43 | 0.000 | Not equal | |
| Step 3b | Collaboration & Communication | Equality of variance | 0.395 | 0.038 | Not equal |
| Data | Equality of variance | 0.661 | 0.026 | Not equal | |
| Perceived Customer Satisfaction | Equality of variance | 0.568 | 0.023 | Not equal | |
| Strategy | Equality of variance | 0.605 | 0.012 | Not equal |
4.10. MGA Analysis
Multi-Group Analysis (MGA) (Table 11) is carried out to identify whether the structural relationship between process standardisation dimensions and the management’s perception of customer satisfaction is significantly different in high- and low-automation firms. Both PLS-MGA and Welch-Satterthwaite tests result in differentiated effects that Data, Inputs, and outputs, and Strategy have on managerial perception of customer satisfaction between the two levels of automation, as indicated by the p-values below the 0.05 level (Data: p = 0.008, 0.009; Inputs and Outputs: p = 0.038, 0.041; Strategy: p = 0.014, 0.016). Conversely, the path coefficient differences between Collaboration and Communication, Governance, and Process Execution were not statistically significant (p > 0.05), indicating the similarity of the effects of these dimensions in different automation contexts. Comprehensively, the results indicate that the managerial assessment of customer satisfaction in terms of standardisation processes depends on the maturity of automation in the specific dimensions to which these specific dimensions are associated with the effect of automation, especially data governance, operational inputs/outputs, and strategic alignment. The remaining dimensions were perceived consistently across companies, regardless of automation, indicating the higher effects of automation on process standardisation.
Table 11. Multi-group analysis.
| Path | PLS MGA Beta | PLS MGA P-Value | Welch-Satterthwaite Beta | Welch-Satterthwaite P-Value | Decision |
| Collaboration & Communication -> PCS | -0.113 | 0.349 | -0.113 | 0.339 | Unsupported |
| Data -> PCS | 0.312*** | 0.008 | 0.312*** | 0.009 | Supported |
| Governance -> PCS | -0.059 | 0.583 | -0.059 | 0.57 | Unsupported |
| Inputs & Outputs -> PCS | 0.245** | 0.038 | 0.245** | 0.041 | Supported |
| Process Execution -> PCS | -0.106 | 0.395 | -0.106 | 0.371 | Unsupported |
| Strategy -> PCS | 0.288** | 0.014 | 0.288** | 0.016 | Supported |
Note: **: Significance at 5%; ***: Significance at 1%
5. DISCUSSION
The results suggest a statistically significant relationship between the degree of process execution and managers’ perception of customer satisfaction. Nonetheless, the effect size of this corresponding measure is very small, indicating that process execution contributes to managerial evaluations but is not a significant contributor compared to other aspects of the standardisation process. Process rigidity reduces variability among similar products and stabilises the production process. Consequently, managers perceive that greater operational consistency in production environments, as suggested by (Baiyere et al., 2020), enhances customer satisfaction. The results support the TQM literature by implying that operational consistency is the main driving force linking process execution to the managerial assessment of customer satisfaction, irrespective of the level of technological intensity. It is not the high automation that makes it effective; rather, it is the way it enhances the reliability of the processes it supports, as it eliminates uncertainty, stabilises workflow, and ensures predictable production results. This interpretation adds to (Al-Shami, 2023; and Teeroovengadum, 2023), who both suggested that process standardisation should be interpreted as more than just a technological characteristic and more as an organisational capability. Consequently, the results shift the focus of execution quality to an instrument for building the confidence of managers in a standardised manufacturing context. A wider implication of this finding is that process execution serves as a dimension of organisational signalling by which operational performance is interpreted by managers. Steady execution decreases uncertainty associated with whether outcomes are attributable to manageable procedures or random disparity, thus firming the confidence of managers in organisational capability. This extends current TQM arguments by signifying that standardisation leads not only to disciplined and improved processes but also to managerial sensemaking. Subsequently, managers evaluate outcomes related to customer satisfaction using the predictability of organisational routines rather than technological complexity alone.
The findings reveal a significant relationship between input-output controls and managerial perceptions of customer satisfaction. However, the effect of input-output standardisation is small and therefore does not form a major consideration in managerial evaluations. It appears that its influence comes from reinforcing operational predictability and process discipline rather than exerting a significant independent effect. Managers consider the consistent use of resources and outputs measured regularly as a reflection of operational discipline and trustworthiness, which are key to defect-free production in Total Quality Management (TQM) (De Ramon et al., 2020). In terms of their impact on customer satisfaction, both high-automation and low-automation environments have positive results; however, the dimensions that create these positive impacts are quite different. The results show that managers view stable input-output control as an indicator of the predictability of the organisation and production discipline, not just technical efficiency. This builds upon the defect prevention logic of TQM, showing that assessments of managers are not just based on output quality, but also on any trust in the consistency of operational controls. The results thus move beyond the discussion of automation differences and allow conclusions to be drawn on how effective a system of control is in terms of standardisation. In line with the findings of (De Ramon et al., 2020), this study underscores the importance of process reliability for managerial assessments by decreasing uncertainty about the continuity of production, compliance with requirements, and process responsiveness. The findings further indicate that input-output standardisation does not only have a function of quality control, but it also has an informational role. If resource inputs are predictable and consistent, managers can see that organisational processes are working as they would expect them to work for the organisation’s service levels. Instead of merely averting defects, standardised controls seem to decrease the uncertainty associated with operational outcomes and strengthen confidence in the reliability of the processes. This is a more comprehensive alternative to previous TQM-related discussions, as it places input-output management in the context of negotiating organisational stability and assessing the chances of maintaining customer-focused results.
Collaboration and Communication had significant effects on the managerial perception of customer satisfaction, and the intensity of its effects was stronger in companies with high automation, supporting H3. Collaboration and communication were statistically significant predictors, but the practical relationship was limited. The results indicate that communication is mostly a facilitator for other mechanisms to work and does not provide a significant independent source of managerial assessments. In Europe and North America, (Al-Shami, 2023) demonstrated that integrated digital systems boost cross-functional coordination because they help resolve problems faster and minimise errors in the processes. The results indicate that cooperation and communication impact managerial perceptions of customer satisfaction by creating process transparency, reliability of the process, and responsiveness of the organisation. These dimensions appear to function as integrative capacities. Instead of being simple communication tools, they help decrease ambiguity in production processes and increase certainty about the continuity of production processes. This perspective builds on an earlier discussion on TQM that focused on the importance of information consistency, in addition to process consistency, in forming managerial assessments of organisational performance. The findings are also consistent with those of (Hossain et al., 2024; and Kanan et al., 2023), who found that structured coordination systems boost managerial confidence, which facilitates predictable decision-making, prompt problem resolution, and transparent accountability for operations. In addition to coordination efficiency, the results show that collaboration and communication can help develop a “shared operational understanding” between organisational functions. As information is shared consistently and transparently, managers can better see how processes relate to each other and understand the potential causes of breakdowns. The findings align with the idea that communication is not only an administrative process but also an organisational tool that facilitates and enables the interpretation of operational outcomes and channels managerial thinking and evaluations of customer outcomes and organisational effectiveness.
The results validate H4, which states that governance structures significantly impact managerial perceptions of customer satisfaction. However, statistically significant governance had only marginal effects in practice. This suggests that the relationship between governance and managerial confidence is indirect through the policy of accountability and procedural clarity but not as a dominant factor affecting perceived customer satisfaction. This can be explained by the fact that managers view governance structures as a reflection of operational reliability and accountability, which aligns with the findings of (Chiarini, 2020). In the context of Malaysian manufacturing, administrative control in a hierarchical structure is combined with process-based regulations to ensure compliance with standard procedures (Al-Omari et al., 2020). The findings suggest that governance influences managerial perceptions of customer satisfaction because of the way it establishes accountability, process discipline, and transparency of operations throughout manufacturing activities. This extends the argument of (Baiyere et al., 2020) as it shows that the transparency of operations shows that governance shapes managerial evaluations by their ability to provide procedural clarity and ensure organisational consistency in variable operational contexts. The findings place governance as a compliance instrument and as a structure that can be relied upon to provide stability in processes and assure quality. The findings show that governance in the manufacturing process is considered a process of making accountability and behavioural expectations institutionalised in the manufacturing process. Thus, governance helps to “de-risk” the framework of responsibility, decision authority, and process ownership, which are elements of customer-related managerial evaluations, not just compliance. This interpretation builds on previous TQM research by focusing on the role of governance in establishing conditions for the organisation to deliver products and services reliably and in a way which the performance is clearly evaluated. Therefore, governance is no longer a control dimension but an enabling structure which builds managerial confidence.
The alignment of process standardisation with organisational goals was one of the factors that strategic planning had a significant influence on managerial perception of customer satisfaction, which proved H5. The overall practical effect of the strategy on managers’ perception of customer satisfaction was statistically significant but small. The results indicate that strategic alignment is used to provide an interpretative perspective that managers use to evaluate operational coherence, but its impact is much smaller than that of data-related practices. As suggested by (Hossain et al., 2024), managers also use strategy integration as an indicator of operational coherence and effectiveness, especially in export-oriented industries, where adherence to global standards is a major concern. The results indicate that strategic alignment enhances managerial perception as it connects process standardisation to the other priorities of the organisation and performance expectations. This interpretation builds upon (Al-Shami, 2023) by showing how managers appreciate the value of operational effectiveness better when the process of standardisation is part of a clear and integrated set of strategic goals than in the form of stand-alone technical procedures. Thus, the findings are presented as a point of strategic integration as an interpretive framework for managers to evaluate the consistency of their operations, their ability to adapt, and guarantee the reliability of their quality results. The overall message is that successful process standardisation is more likely to be strategically embedded as an institutional structure where managers can make sense of operational data based on a predictable and coordinated sense of direction.
The results show that data was the strongest predictor in both automation groups, which justifies H6. Managers view proper, timely, and actionable information as a promise of reliable operations and process stability, which informs the managerial evaluation of quality and operational performance, as supported by (Baiyere et al., 2020). The processes by which data inform managerial assessments indicate variations in process combinations and the flow of information, not technology itself. Adequate data governance allows managers to track deviations, identify defects beforehand, and make sound corrective decisions, consequently improving the perception of operational uniformity (Rane, 2023). There is global evidence that organised data practices enhance responsiveness and oversight in manufacturing systems in the US, Europe, and East Asia, as stated in the same study. Practically, the reliability of the output is reinforced when the data collection, monitoring, and evaluation approaches are systematic, and the manager can make proactive adjustments to the processes (Hamoud et al., 2020). The saliency of data as the best predictor indicates that data is becoming a key factor in the way managers assess the performance of their organisation. Data eliminate informational asymmetry by providing evidence-based information on process behaviour, deviation, and improvement options. This is an important finding that complements past research by revealing that information visibility alone can be a strategic organisational resource. Data do not just inform; they seem to influence decision-making by managers because they make the results of operations more comprehensible and help make the decision-making process more reliable.
Altogether, the findings provide evidence that the success of process standardisation is less a function of the level of automation than a function of the amount that organisations can achieve through the creation of consistency, reliability, and confidence in process control. Theoretically, this study extends the traditional view of the concept of technical quality systems in TQM to a broader perspective on standardisation as an organisational coordination capability. In manufacturing environments, managers seem to measure customer satisfaction based on the level of predictability, accountability, and process stability rather than on the level of technology. The results present a more complex picture of the role of standardisation in managerial evaluations in technologically heterogeneous manufacturing settings.
CONCLUSION
The research shows that process standardisation in various dimensions, such as Process Execution, Inputs and Outputs, Collaboration and Communication, Governance, Strategy, and Data, is a critical factor in improving the perceived customer satisfaction in Malaysian manufacturing companies. High-automation companies take advantage of integrated systems to streamline the flow of data, coordination, and strategic implementation, but low-automation companies use managerial supervision, procedural discipline, and relationship management to achieve a similar result. Comparisons with international research point out that the main principles of TQM are universal, but their adaptations to local technological and cultural contexts are needed. Overall, this study holds that process standardisation is not just a procedural requirement but a strategic facilitator, such that it harmonises business practices, organisational governance, and evidence-based decision-making with customer needs, which provides a sustainable channel of quality enhancement and competitive edge in the Malaysian manufacturing industry.
LIMITATIONS AND FUTURE DIRECTIONS
The design of this study limits causal inferences with PLS-SEM, since it is cross-sectional and therefore limited to causal inferences, and all the data used are self-reported and are subject to biases of response. Although the sample was balanced in terms of the number of high- and low-automation companies, it was based solely on a few manufacturing industries in Malaysia and cannot be applied to other industries or countries. Finally, the use of online channels to recruit participants presents the risk of urban and digital maturity bias. With rural or less digitally connected plants, employees might not be adequately represented, and this has implications for the generalisability of the findings. The limitation to the external validity of the research is the purposive sampling required to focus on respondents with relevant managerial experience.
Therefore, managerial perceptions can be biased upward, similar to the wider population. Future studies must also consider the use of probability-based sampling or stratified sampling methods to facilitate generalisability and the inclusion of less digitally integrated or smaller manufacturing companies. In future research, alternative recruiting approaches should be incorporated to include a wider range of manufacturing settings. Future studies should embrace longitudinal designs to reflect the dynamics of process standardisation over time and consider multi-source data, including operational performance measures.
In addition, the investigation of moderating variables, including organisational culture, employee engagement, and the maturity of technological usage, may help reveal more information about the standardisation of the managerial perception of customer satisfaction in different industrial and cultural settings. Furthermore, another limitation is the use of purposive sampling using LinkedIn and other digital platforms, which could create significant sampling bias and thereby limit the generalisability of the results. The sampling approach probably oversampled manufacturing companies that are technologically connected, digitally mature, and based in urban centres, for which the manager has more experience with process standardisation and automation systems. In turn, the managerial ratings of customer satisfaction are more positive, as the respondents are more likely to be professionally networked, operationally informed, and experienced with digital quality practices than companies in less networked contexts. Therefore, the results should be treated with caution because they are not indicative of all smaller, rural, less digitised, and isolated manufacturing operations in the wider manufacturing industry in Malaysia.
POLICY IMPLICATIONS
The findings offer important policy implications for industry stakeholders, considering the firm level of the study. These findings imply that manufacturing associations and support agencies in Malaysia can find it appropriate to promote process standardisation practices that reinforce process execution, input-output controls, and data-driven monitoring, as they were identified with greater managerial perception of customer satisfaction. Instead of requiring regulatory changes, stakeholders can stimulate knowledge-sharing options, voluntary training, and specific advisory support to help companies, especially less-automated ones, enhance their governance and coordination practices. Incentive plans based on gradual integration into digital may also be helpful in a limited way. However, these implications should be viewed in the context and parameters of the study and not in the context of other comparable firm-level settings.
LIST OF ABBREVIATIONS
AVE | = | Average Variance Extracted |
CMB | = | Common Method Biases |
MGA | = | Multi-Group Analysis |
PLS-SEM | = | Partial Least Squares Structural Equation Modelling |
TQM | = | Total Quality Management |
AUTHOR’S CONTRIBUTION
F.A.B. has contributed to the study conceptualization, methodology, data analysis, interpretation of results, and manuscript writing.
ETHICAL APPROVAL & INFORMED CONSENT
The research was conducted following established ethical guidelines, with formal approval obtained from the designated institutional ethics committee. All procedures involving human participants adhered to standards ensuring their safety, confidentiality, and ethical treatment throughout the study. Participants were fully informed about the purpose of the research, the procedures involved, and their rights prior to taking part. Written consent was obtained, confirming voluntary participation, with the assurance that individuals could withdraw at any point without any negative repercussions.
AVAILABILITY OF DATA AND MATERIALS
The data will be made available on reasonable request by contacting the corresponding author [F.A.B.].
FUNDING
None.
CONFLICT OF INTEREST
The author declares that there is no conflict of interest regarding the publication of this article.
ACKNOWLEDGEMENTS
Declared none.
DECLARATION OF AI
The author affirms that this study was carried out independently, without any conflicts of interest. All data collected were used exclusively for research purposes, maintaining participant confidentiality and anonymity. Furthermore, the manuscript reflects original work that has not been submitted elsewhere. The author declares that AI-assisted tools were used only for language editing and readability enhancement. AI was not used for data generation, analysis, interpretation, or scientific decision-making. The author take full responsibility for the originality, accuracy, and integrity of the manuscript.
APPENDIX A
Questionnaire: Demographics
Demographics Factor | Response Options |
Gender | ☐ Male ☐ Female |
Age | ☐ 18–25 ☐ 26–35 ☐ 36–45 ☐ 46–55 |
Occupation / Role | ☐ HR Manager ☐ Supervisor ☐ Department Head ☐ Administrative Officer |
Department | ☐ Production ☐ Quality ☐ IT |
Perceived Level of Automation | ☐ High Automation ☐ Low Automation |
Primary mode of information sharing across departments | ☐ Email and spreadsheets ☐ Integrated digital systems ☐ Real-time system integration |
Level of system-based data capture in production and operations | ☐ Captured at selected stages ☐ Captured across most processes ☐ Fully system-generated data |
Survey Questionnaire
Process Execution | SD | D | N | A | SA |
This business process contains many exceptions regarding its execution. (reverse) | |||||
This business process always follows exactly the same steps. | |||||
Process participants always perform activities of this business process in the same way. | |||||
Inputs & Outputs | |||||
Each time this process is executed it produces exactly the same predefined output. | |||||
Inputs of this process are well known and predictable before the process is executed. | |||||
Outputs of this process are custom-made. (reverse) | |||||
Collaboration & Communication | |||||
Collaboration in this business process is based on a common terminology. | |||||
Process participants know the procedures of people and teams they collaborate with. | |||||
In this process, our organisation emphasises structured collaboration instead of occasional or informal changes. | |||||
Governance | |||||
To monitor this process, our organisation uses common key performance indicators. | |||||
To steer this process, all stakeholders have clear roles and responsibilities. | |||||
To ease control, local changes to this process are incorporated in the global standard. | |||||
Strategy | |||||
According to our strategy, in this process it is more important to realise returns of scale than to respond quickly to environmental changes, such as customer demands and market dynamics. | |||||
It is our strategy to adapt products and services of this process to the wants and needs of local markets. (reverse) | |||||
It is our strategic focus for this process, to realise fast growth. (reverse) | |||||
Data | |||||
Data for this process is highly consistent. | |||||
Data used in this process is accessible via a centralised repository. | |||||
The type of data maintained for this process is always the same. | |||||
Managerial perception of customer satisfaction. Adapted from (Ribbink et al., 2004) | |||||
Our customers are generally pleased with the consistency and reliability of products delivered by our company. | |||||
Our customers our satisfied with our products as they meet their quality expectations due to well-controlled and standardised operational processes. | |||||
Our customers enjoy using our products, produced through standardised manufacturing process. |
REFERENCES
Abdallah, A. B., Alfar, N. A., & Alhyari, S. (2021). The effect of supply chain quality management on supply chain performance: The indirect roles of supply chain agility and innovation. International Journal of Physical Distribution & Logistics Management, 51(7), 785-812.
https://doi.org/10.1108/IJPDLM-01-2020-0011
Al-Omari, Z. S., Alomari, K. A. A., & Aljawarneh, N. M. (2020). The role of empowerment in improving internal process, managerial perception of customer satisfaction, learning and growth. Management Science Letters, 10(4) 841-848.
https://doi.org/10.5267/j.msl.2019.10.013
Al-Shami, H. A., & Abdullah, S. (2023). Halal food industry certification and operation challenges and manufacturing execution system opportunities. A review study from Malaysia. Materials Today: Proceedings, 80, 3607-3614.
https://doi.org/10.1016/j.matpr.2021.07.331
Atieh, A. A., Abu Hussein, A., Al-Jaghoub, S., Alheet, A. F., & Attiany, M. (2025). The impact of digital technology, automation, and data integration on supply chain performance: Exploring the moderating role of digital transformation. Logistics, 9(1), 11.
https://doi.org/10.3390/logistics9010011
Baiyere, A., Salmela, H., & Tapanainen, T. (2020). Digital transformation and the new logics of business process management. European Journal of Information Systems, 29(3), 238-259.
https://doi.org/10.1080/0960085X.2020.1718007
Castillo, A., Rescalvo-Martin, E., & Karatepe, O. M. (2026). How is common method bias addressed using partial least squares structural equation modeling in hospitality and tourism research?. Tourism Review, 81(1), 204-228.
https://doi.org/10.1108/TR-07-2025-0762
Chiarini, A. (2020). Industry 4.0, quality management and TQM world. A systematic literature review and a proposed agenda for further research. The TQM Journal, 32(4), 603-616.
https://doi.org/10.1108/TQM-04-2020-0082
Chou, S-F., & Lin, J-Y. (2023). Sustainable innovation and creative behavior: The mediating effect of technology application from early adopters. International Journal of Information Technology & Decision Making, 22(04), 1289-1318.
https://doi.org/10.1142/S0219622022500699
Delić, M., Tasić, N., Todić, V., Todorović, T., & Vidicki, P. (2026). The effect of total quality management on organisational performance: A systematic review and meta-analysis of Structural Equation Modelling (SEM) studies. Sustainability, 18(10), 4857.
https://doi.org/10.3390/su18104857
De Ramon Fernandez, A., Ruiz Fernandez, D., & Sabuco Garcia, Y. (2020). Business process management for optimizing clinical processes: A systematic literature review. Health Informatics Journal, 26(2), 1305-1320.
https://doi.org/10.1177/1460458219877092
Farouk, A. M., Zulhisham, A. Z., Lee, Y. S., Rajabi, M. S., & Rahman, R. A. (2023). Factors, challenges and strategies of trust in BIM-Based construction projects: A case study in Malaysia. Infrastructures, 8(1) 13.
https://doi.org/10.3390/infrastructures8010013
Hair, J. F., Babin, B. J., Ringle, C. M., Sarstedt, M., & Becker, J-M. (2025). Covariance-based structural equation modeling (CB-SEM): A SmartPLS 4 software tutorial. Journal of Marketing Analytics, 13, 709-724.
https://doi.org/10.1057/s41270-025-00414-6
Hamoud, A. K., Hussien, H. N., Fadhil, A. A., & Ekal, Z. R. (2020). Improving service quality using consumers’ complaints data mart which effect on financial customer satisfaction. Journal of Physics: Conference Series. 1530, 012060.
https://doi.org/10.1088/1742-6596/1530/1/012060
Hossain, M. I., Kumar, J., Islam, M. T., & Valeri, M. (2024). The interplay among paradoxical leadership, industry 4.0 technologies, organisational ambidexterity, strategic flexibility and corporate sustainable performance in manufacturing SMEs of Malaysia. European Business Review, 36(5), 639-669.
https://doi.org/10.1108/EBR-04-2023-0109
Hossain, M. I., Ong, T. S., Jamadar, Y., Teh, B. H., & Islam, A. (2025). Nexus among green entrepreneurship orientation, green ambidexterity innovation, green technological turbulence and green performance: Moderated-mediation evidence from Malaysian manufacturing SMEs. European Journal of Innovation Management, 28(7), 2761-2783.
https://doi.org/10.1108/EJIM-04-2024-0495
Invest Malaysia. (2025). Malaysia records historic high RM378.5 billion in investments, with 14.9% Y-O-Y growth, generating more than 207,000 jobs in 2024. Available from: https://www.investmalaysia.gov.my/resources/latest-announcements/malaysia-records-historic-high-rm3785-billion-in-investments-with-149-y-o-y-growth-generating-more-than-207-000-jobs-in-2024/ (Accessed on: 01 July, 2026).
Jaeger, B., & Upadhyay, A. (2020). Understanding barriers to circular economy: Cases from the manufacturing industry. Journal of Enterprise Information Management, 33(4), 729-745.
https://doi.org/10.1108/JEIM-02-2019-0047
Jalaludin, N. A., Sadun, A. S., Chulakit, S., Hashim, H., Ahmad, S., Sabarudin, N. A., Fauzi, M. A., & Wang, Z. (2024). Malaysia’s manufacturing landscape: Current challenges and production strategies. Journal of Advanced Research Design, 123(1), 213-225.
https://doi.org/10.37934/ard.123.1.213225
Kanan, M., Dababat, H., Saleh, Y., Zaid, A., Assaf, R., Zahran, S., Salahat, M. A., & Al-Sartawi, A. (2023). Impact of total quality management practices on the transformation to entrepreneurial universities in Palestine: The moderating role of innovation. Operational Research in Engineering Sciences: Theory and Applications, 6(3), 34-56. Available from: https://oresta.org/menu-script/index.php/oresta/article/view/620/184
Karim, A., & Said, F. (2024). Discussion on Malaysia’s globalization journey from resource-based economy to global player. Journal of Business and Economic Options, 7(1), 29-38. Available from: https://resdojournals.com/index.php/jbeo/article/view/252/214
Kerpedzhiev, G. D., König, U. M., Röglinger, M., & Rosemann, M. (2021). An exploration into future business process management capabilities in view of digitalization: Results from a Delphi study. Business & Information Systems Engineering, 63(2), 83-96.
https://doi.org/10.1007/s12599-020-00637-0
Lepistö, K., Saunila, M., & Ukko, J. (2024). Enhancing customer satisfaction, personnel satisfaction and company reputation with total quality management: Combining traditional and new views. Benchmarking: An International Journal, 31(1), 75-97.
https://doi.org/10.1108/BIJ-12-2021-0749
Lionello, M., Aletta, F., Mitchell, A., & Kang, J. (2021). Introducing a method for intervals correction on multiple Likert scales: A case study on an urban soundscape data collection instrument. Frontiers in Psychology, 11, 602831.
https://doi.org/10.3389/fpsyg.2020.602831
Lu, Y., Xu, X., & Wang, L. (2020). Smart manufacturing process and system automation- A critical review of the standards and envisioned scenarios. Journal of Manufacturing Systems, 56, 312-325.
https://doi.org/10.1016/j.jmsy.2020.06.010
Maganga, D. P., & Taifa, I. W. R. (2023). Quality 4.0 conceptualisation: An emerging quality management concept for manufacturing industries. The TQM Journal, 35(2), 389-413.
https://doi.org/10.1108/TQM-11-2021-0328
Masod, M. Y., & Zakaria, S. F. (2024). Redefining Malaysia’s printing landscape: Insights from Porter’s CAN Model. Jurnal Intelek, 19(1), 20-33. http://doi.org/10.0.94.127/ji.v19i1.24422
Malaysian Investment Development Authority (MIDA) (2024). Services, manufacturing made up 82.6 per cent of economy in 2023. Available from: https://www.mida.gov.my/mida-news/services-manufacturing-made-up-82-6-per-cent-of-economy-in-2023/ (Accessed on: 01 July, 2026).
Nwosu, S. C., Atulomah, N. O., Nwankwo, N. V., & Suleiman, J.F. (2024). Influence of Educational-Intervention Program on Adherence to Workplace-Ergonomic Principles among Catering Staff of Selected Universities in Ogun State, Nigeria. Babcock University Medical Journal, 7(1), 88-95.
https://doi.org/10.38029/babcockuniv.med.j..v7i1.193
Perez Alonso, A. F., Rosseel, Y., Vermunt, J. K., & De Roover, K. (2024). Mixture multigroup structural equation modeling: A novel method for comparing structural relations across many groups. Psychological Methods. 1-25.
https://dx.doi.org/10.1037/met0000667
Poornachandrika, V., & Venkatasudhakar, M. (2020). Quality transformation to improve customer satisfaction: using product, process, system and behaviour model. In IOP Conference Series: Materials Science and Engineering, 923, 012034.
https://doi.org/10.1088/1757-899X/923/1/012034
PROQC International. (2024). Manufacturing in Malaysia: Opportunities, Challenges & Quality Control. Available from: https://proqc.com/blog/manufacturing-in-malaysia/ (Accessed on: 01 July, 2026).
Psarommatis, F., Sousa, J., Mendonça, J. P., & Kiritsis, D. (2022). Zero-defect manufacturing the approach for higher manufacturing sustainability in the era of industry 4.0: A position paper. International Journal of Production Research, 60(1), 73-91.
https://doi.org/10.1080/00207543.2021.1987551
Rane, N. (2023). Enhancing customer loyalty through Artificial Intelligence (AI), Internet of Things (IoT), and Big Data technologies: Improving customer satisfaction, engagement, relationship, and experience.
http://dx.doi.org/10.2139/ssrn.4616051
Ribbink, D., Van Riel, A. C., Liljander, V., & Streukens, S. (2004). Comfort your online customer: Quality, trust and loyalty on the internet. Managing Service Quality: An International Journal, 14(6), 446-456.
https://doi.org/10.1108/09604520410569784
Saxena, D., & McDonagh, J. (2020). Exploring Enterprise Information Systems Procurement in Public Service Organisations. Electronic Journal of e-Government, 18(1), 54-68.
https://doi.org/10.34190/EJEG.18.1.005
Shamsudin, M. F., Hassim, A. A., & Abd Manaf, S. (2024). Mastering probability and non-probability methods for accurate research insights. Journal of Postgraduate Current Business Research, 9(1), 38-53. Available from: http://abrn.asia/ojs/index.php/jpcbr/article/view/157
Teeroovengadum, V. (2023). Service quality dimensions as predictors of customer satisfaction and loyalty in the banking industry: Moderating effects of gender. European Business Review, 34(1), 1-19.
https://doi.org/10.1108/EBR-10-2019-0270
Torlak, N. G., Demir, A., & Budur, T. (2020). Impact of operations management strategies on customer satisfaction and behavioral intentions at café-restaurants. International Journal of Productivity and Performance Management, 69(9), 1903-1924.
https://doi.org/10.1108/IJPPM-01-2019-0001
Uzoka, A., Cadet, E., & Ojukwu, P. U. (2024). Leveraging AI-Powered chatbots to enhance customer service efficiency and future opportunities in automated support. Computer Science & IT Research Journal, 5(10), 2485-2510.
https://doi.org/10.51594/csitrj.v5i10.1676
Viriyasitavat, W., Da Xu, L., Bi, Z., & Sapsomboon, A. (2020). Blockchain-based business process management (BPM) framework for service composition in industry 4.0. Journal of Intelligent Manufacturing, 31, 1737-1748.
https://doi.org/10.1007/s10845-018-1422-y
Wurm, B., Schmiedel, T., Mendling, J., & Fleig, C. (2018). Development of a measurement scale for business process standardisation. In ECIS 2018 Research Papers (Paper 21). Available from: https://aisel.aisnet.org/ecis2018_rp/21
Yusuf, M. F., Mohamad Nasarudin, N. A. I., Sorooshian, S., Fauzi, M. A., & Kasim, N. M. (2023). Exploring the impact of contingency theory on sustainable innovation in Malaysian manufacturing firms. Sustainability, 15(9), 7151.
https://doi.org/10.3390/su15097151
Zuhaira, B., & Ahmad, N. (2021). Business process modeling, implementation, analysis, and management: The case of business process management tools. Business Process Management Journal, 27(1), 145-183.
https://doi.org/10.1108/BPMJ-06-2018-0168
Licensed
© 2026 Copyright by the Authors.
Licensed as an open access article using a CC BY 4.0 license.
Article Contents Author Wahaj Anees1, * 1Department of Forensic Sciences, Institute of Basic Medical Sciences- Khyber Medical University, Peshawar, Pakistan
Article Contents Author Danish Rahman1, * Matias Garcia-Constantino1 1School of Computing, Ulster University, Belfast Campus, BT151AP, United Kingdom Article History:
Article Contents Authors Saqib Hussain Hadri1, Muhammad Hassnain1,* , Aqsa Arshed1, Shamaiza Kousar1, Aleeza Yasmeen1, Nuzhat Latif1, Kiran Ijaz1, Maryam
Article Contents Author Amal S. Al Saadi1, * 1Sohar University, Sohar, Oman Article History: Received: 13 June, 2026 Accepted: 09
Article Contents Author Olabode Adeyemi David1, * , Nduka Christiana1, Akazue Ruth Chioma1, Amos Mishael1 1Department of Animal Production,
Article Contents Author Muzmmil Memon1, * 1Department of Computer Science Management, Avila University, Kansas City, Missouri, United States Article History: