


Article ID: CM2601105002
Views: 6181Wavelet Transforms in Financial Time Series Analysis: A Review on Stock Price Prediction
 PDF
PDF
⬇ Downloads: 70
2.2. Common Wavelet Families
Selection of an appropriate mother wavelet is based upon a few prominent qualities, which affect its independent operation. Due to orthogonality, the energy of a signal is preserved under the transform and, hence, is also fast to reconstruct. Vanishing moment number is also valid; the wavelets that contain N vanishing moments are not affected by trends of polynomials of order N−1 and are therefore well adapted to signal compaction, like local features extraction. For example, the Daubechies ‘dbN’ series contains N vanishing moments. Finally, additional qualities such as support (how local in time the wavelet analysis is) and symmetry (which may be used to avoid phase distortion during analysis) are also of interest. For example, Haar wavelets are non-continuous and therefore optimal for detecting sharp jumps. In contrast, smoother variants such as Daubechies or Symlet wavelets are preferred for trend analysis of less erratic data.
The choice of the mother wavelet is a critical aspect of wavelet analysis, as its shape and inherent properties determine how a signal is broken down and which features are highlighted. It is said that different wavelet families analyze different characteristics of the financial data better [21, 22] and finding an “optimal” wavelet for any given dataset is an important issue to be performed to get accurate results in modeling and forecasting [23, 24]. Wavelet transforms are conventionally used to decompose financial time series into components that can be analyzed or forecasted separately [25–27], often improving performance against models with raw data. They are a powerful tool for analyzing nonlinear dynamics, especially in the high-frequency domains of financial data such as cryptocurrencies [28], and for capturing cyclical characteristics at different time scales [29]. Wavelet denoising is another important application that aims to separate signals from noise before further processing or prediction [30, 31].
- Haar: The Haar wavelet is the simplest and oldest type. It works by representing signals as step-like functions, making it effective for detecting abrupt changes or discontinuities in signals [13] and for compactly representing signals and images [32]. It is computationally efficient, but its abrupt nature may not be ideal for smooth financial data and it may produce noisier series than smoother wavelets when studying stationarity [33, 34]. It is also known as the B-spline wavelet of order 1 (BS1) [35]. It has been used in the Wavelet Deep Average (WDA) model for cryptocurrency prediction [36] and in conjunction with db8 for DWT denoising [16]. [37] Conducted a comparative study including Haar wavelets for agricultural price forecasting. The SWIFT model also utilizes the Haar wavelet due to its computational efficiency and stable transformations [38]. Haar wavelets are also employed with ARIMA models for forecasting financial time series [36, 37], for modeling the banking sector [37], and for decomposing yield spreads in wavelet neural network models [22]. They have been used as a wavelet-based OLS estimator to investigate long-term memory in stock prices [39] and are mentioned in the context of jump detection in high-frequency data analysis using MODWT [40]. Comparative analyses show that Haar can effectively capture the characteristics of financial data [41]. Furthermore, Haar wavelets are used to approximate the distribution of credit portfolio losses [42]. In some numerical studies on financial data, Haar has been found to perform well in solving autocorrelation problems and denoising data [43]. It is also used for noise reduction in trading systems [44] and is a fundamental DWT family for analyzing high-frequency data [45].
- Daubechies (dbN): This family provides a good balance of properties for general signal analysis, including financial time series. These wavelets are orthogonal, compactly supported, and their smoothness increases with the order ‘N’, making them effective for capturing trends and specific events within data [40]. The ‘N’ in dbN refers to the number of vanishing moments [13, 15]. Specifically consider Daubechies wavelets as input features for forecasting models. They are commonly used for decomposing financial data, [37, 41, 46] and for analyzing financial time series more generally [40]. Specific Daubechies wavelets (such as d4, db5, and La8) have been used in ARIMA-Wavelet models for credit loss forecasting [47] and in wavelet neural networks for yield spread forecasting, with Db4 showing high performance [22]. Daubechies wavelet analysis has been found to provide an accurate determination of long-term memory effects in stock prices [42]. Various orders have been tested for optimality in financial cascade models [23] and for real-time denoising in stock index prediction [39]. D4 is also mentioned for jump detection in high-frequency data [43]. They are also a common choice for analyzing high-frequency financial data [46].
- Symlets (symN): Symlets are similar to Daubechies wavelets but are designed to be more symmetric, which can be better for feature analysis when phase distortion is a concern [13]. They have been considered for data decomposition [48], financial time-series stationarity [29, 30, 41], and real-time denoising in stock index prediction [39]. Symlet 7 was identified as potentially optimal for analyzing stock market volatility [23], and Symlet 16 has been used to detect business cycles in GDP data [49]. They are also listed as a DWT family for high-frequency data analysis [47]. Symlets3 specifically has been used to decompose stock market returns for cointegration analysis [32, 50].
- Coiflets (coifN): Coiflets are nearly symmetric and orthogonal, with vanishing moments for both the wavelet and scaling function, proper for data compression and smooth feature representation [28, 51, 52]. The WT-ATT-LSTM model employs Coif3 for denoising [6]. Coiflet wavelet decomposition has been shown to improve ARIMA forecasting for electricity demand [48]. They are also used to study stationarity [41], in ARIMA-Wavelet models for LGD [49], tested for optimality [23], numerically investigated for financial time series [45], used for decomposing yield spreads [22], and for real-time denoising in stock index prediction [39]. They are also a common choice for analyzing high-frequency financial data [46].
- Morlet: This wavelet is well-suited for analyzing wavelike patterns and identifying specific frequency content that changes over time. It is commonly used in CWT for studying time-varying correlations [53, 54], analyzing cryptocurrency price dynamics [38], data mining of financial time series for cyclical components [55], and in wavelet coherence analysis for studying financial market contagion [56]. It can also transform stock price data into 2D scalogram images for anomaly detection [57] and form kernels for SVMs [58].
- Meyer: The Meyer wavelet is infinitely smooth and orthogonal. Its infinite support can sometimes be a limitation. A discrete approximation (dmey) has been used to study financial time series stationarity [34, 41], numerically investigated for financial data analysis [59, 60], used to decompose yield spreads [22], and listed as a DWT family [46].
- Biorthogonal (biorNr.Nd) & Reverse Biorthogonal (rbio): Biorthogonal wavelets offer flexibility with symmetric, linear-phase properties, excellent for perfect signal reconstruction [59]. They are used in various forecasting studies [48], numerically studied for financial data [45], and for real-time denoising in stock index prediction [39]. Specific types, such as Cdf9/7 [61, 62] and Bior (4.4) [58], are used in SVM kernels. Battle-Lemarié wavelets (spline-based, can be biorthogonal) were found optimal for log-price stock data [23] and are listed as a DWT family [46].
- B-Spline (BSd) Wavelets: These provide local DWTs; Haar is BS1 [42]. Higher-order B-splines are smoother, decomposing time series into less erratic components, which is beneficial for ANNs [42]. Battle-Lemarié wavelets are also spline-based [23, 46].
- CDF Wavelet: Mentioned as a DWT family suitable for high-frequency data analysis [46]. (Often Cohen-Daubechies-Feauveau, a type of biorthogonal wavelet).
- Shannon Wavelet: Listed as a DWT family that can be used for high-frequency data analysis [46].
- Gaussian Wavelet Kernel: Refers to using a Gaussian function derivative to create a kernel for SVMs in financial forecasting [58].
- General Wavelet Applications in Finance: Wavelets are widely used to decompose non-stationary financial signals into features capturing multi-scale dynamics [31, 46, 50, 57]. Denoising is a key application, especially for high-frequency data [39, 43]. Wavelet correlation and coherence are used to study market comovement and contagion [54, 56, 63]. Hybrid models combining wavelets with ARIMA or ANNs often improve forecast accuracy [22, 36, 37].
To aid researchers and practitioners in selecting appropriate wavelet families, Table 1 summarizes standard wavelets, their key characteristics, and their suitability for specific financial data properties, along with example studies. This consolidated view is valuable because the choice of mother wavelet is crucial yet often non-obvious. The table aims to link the mathematical properties of wavelets to the practical characteristics of financial data (e.g., Haar for sharp jumps, smoother wavelets like Daubechies or Symlets for trends). It illustrates these links with examples from the surveyed literature. This can foster more informed methodological decisions by providing practical guidance and reducing the effort required to assess the applicability of each wavelet family individually.
Table 1. Summary of wavelet families and their characteristics for financial data.
| Wavelet Family | Key Characteristics | Suitability for Financial Data Properties | Example Studies |
| Haar | Discontinuous, Orthogonal, Compact Support | Detecting abrupt changes, price jumps, structural breaks; Computationally very efficient. | WDA for crypto [43], SWIFT model [41], Part of DWT denoising with db8 [16], Agricultural prices [44] |
| Daubechies (dbN) | Orthogonal, Asymmetric, Compact Support, N vanishing moments | Good general-purpose; Smoothness increases with N; Capturing trends and localized events. | Feature input [47], Agricultural prices [44] |
| Symlets (symN) | Near Symmetric, Orthogonal, Compact Support | Similar to Daubechies but with less phase distortion; Good for feature analysis. | General time-series analysis [13] |
| Coiflets (coifN) | Near Symmetric, Orthogonal, Vanishing moments for ϕ & ψ | Good for compression and signal reconstruction; Smooth feature representation. | WT-ATT-LSTM for NIFTY 50 denoising (Coif3) [55]. |
| Morlet | Non-orthogonal, Complex-valued, Gaussian-shaped | Analyzing oscillatory patterns, frequency content, and time-varying correlations (e.g., in wavelet coherence). | Wavelet coherence analysis [64] |
| Biorthogonal | Symmetric, Linear Phase (allows perfect reconstruction) | Signal reconstruction, applications where phase is important. | Bior (4.4) wavelet kernel SVM (older study) [65, 66] |
2.3. Wavelet Applications in Preprocessing Financial Time Series
Wavelet analysis offers several powerful methods for preprocessing financial time series data before feeding it into machine learning models. These preprocessing steps aim to improve data quality, extract relevant information, and enhance the overall predictive performance of the models.
2.3.1. Denoising Financial Time Series
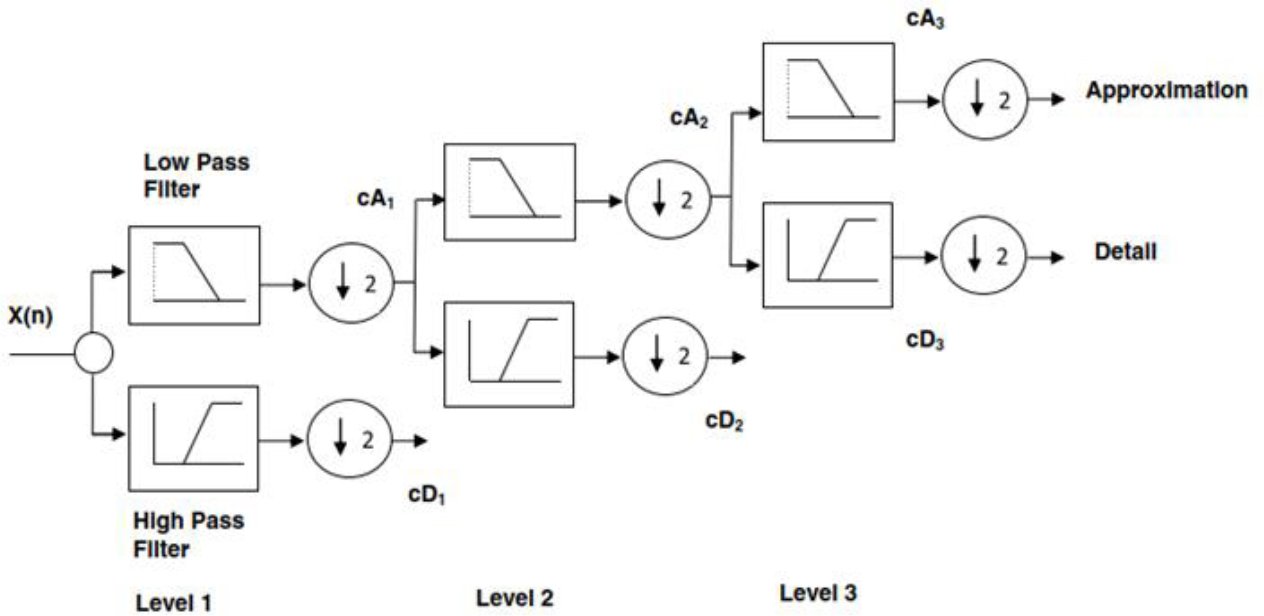
Financial time series are inherently noisy, with underlying signals often blurred by random noise, changes in market sentiment, and high-frequency trading. Wavelet transforms are ideal for separating the underlying signal from noise [26, 27, 67, 68]. The procedure usually entails decomposing the signal at various frequency levels, thresholding the detail coefficients (which mainly comprise noise at higher frequencies) to set them to zero, and reconstructing the signal from the modified coefficients [13, 69].
Several thresholding techniques are available. Two of the most popular are hard thresholding, in which the coefficients of details below the threshold in absolute value are set to zero, and soft thresholding, which also sets coefficients of little value to zero and, in addition, shrinks non-zero coefficients toward zero. More adaptive techniques include the universal threshold (VisuShrink) and Stein’s Unbiased Risk Estimate (SUREshrink) [55]. The paper by [46], which employed SWT for decomposition-based denoising, includes a denoising/feature augmentation step, and [45] uses wavelets explicitly to denoise for predicting Bitcoin prices.
These effects on the time series can be dramatic, and wavelet denoising has been shown to yield smoother results with clearer underlying trends, making the denoised time series ideal input data for ML models. The former naturally leads to better prediction accuracy [55]. For instance, [16] showed that denoised stock data had stable trend features and smoothness, which significantly helped their ELM-based prediction model. The consistent success, as seen in numerous studies including wavelet denoising as a first stage, suggests that correcting the huge signal-to-noise ratio of financial data is an essential step for successful ML-based forecasting. To the best of our knowledge, the popularity of wavelet denoising and its promising results indicate that it is not merely a supplementary preprocessing approach, but also strongly recommended and/or even inevitable to improve learning performance in noisy financial domains. It underscores the aphorism that the quality of data required to feed an ML model is paramount, and wavelet denoising becomes a crucial approach to ensure higher input quality, enabling models to learn meaningful, actual underlying patterns rather than occasional ripples [55].
2.3.2. Feature Extraction and Engineering Using Wavelets
Aside from denoising, wavelet transforms are a powerful tool for feature engineering in financial machine learning. One of the closest applications considered in the early work of [13] relies on wavelet coefficients as input features. [51] Provide a recent example of this principle. This simple yet successful strategy, along the lines discussed in Section 2, involves using Daubechies wavelet coefficients as predictors in their forecasting procedures. However, the above approach is simple, and in recent years, a more sophisticated multiwork item has been used, recognizing that the complete set of coefficients may be high-dimensional and noisy.
This led to calculating a denser collection of statistics on the wave`let sub-bands than on mean, variance, energy, or entropy. It is also notable that complexity-based quantities, like wavelet entropy, have been tested and implemented [6]. [71], among others, demonstrated significant performance gains when using wavelet entropy in deep learning models to forecast stock indices and forex volatility. However, this strategy of having a large pool of features also introduces a new problem: feature selection. The DWT-CSO approach [6] uses a bio-inspired CSO (Chicken Swarm Optimization) algorithm to select the optimal subset of wavelet features, thereby avoiding overfitting.
As observed, it is this transformation to a space in which the one-dimensional time series is rescaled with respect to different scales and locations of (known) features that gives wavelet-based methods their predictive advantage. It allows models to quantify and potentially even harvest an entire class of phenomena that are virtually invisible in raw price data: complex operational regimes of volatility that come and go, faint cyclical behaviors that only reveal themselves over particular timescales, changes in market complexity, and on and on [72, 73].
This approach provides machine learning models with a richer, multi-horizon portrait of market dynamics, allowing them to see finer-grained, scale-dependent patterns governing financial returns across many scenarios.
3. HYBRID FORECASTING MODELS
Wavelet transforms are better predictors, in terms of relative RMS prediction errors, when used both as a preprocessing step and as the primary processing step within a hybrid model [74]. The literature indeed claims that there is a strong consensus that, for any ML algorithm, using its wavelet decomposition as a feature space yields better generalization than applying one of these techniques alone. All the arguments around synergy apply to this combination.
Wavelets are noise-diggers, and there is nothing else they do or multiply with directly to the features (unless more complex representations other than just removing noise where latent patterns can hide are made, i.e., denoising raw time series, coding a richer, multi-scale set of values, etc.). This provides a much cleaner, more organized view of market dynamics for the ML model to learn from, resulting in much higher efficiency and accuracy [75]. Therefore, this part will investigate the most impactful ML architectures used as engines for these strong hybrid frameworks.
3.1. Wavelet-Neural Network Hybrids
Given that financial markets are complex and highly non-linear, Neural Networks (NNs) have become central to predictive modeling. Their great strength lies in their generalization power: they are universal function approximators that can learn complex dependencies that classic linear methods cannot model. It is particularly compelling in conjunction (synergetically) with wavelet preprocessing [76].
Wavelets handle the complexity of the preprocessed data. They separate a noisy, time-varying signal into primitives and more stable elements. This enables the NN to master valuable regularities in the field and thus achieve more than reported in the literature [77, 78]. This is in line with the trend toward the application of hybrid financial models and aligns with earlier research, such as contrasting different network configurations [79, 80] or NNs coupled with statistical forecasting models, such as ARIMA, to boost forecasting performance [81].
- Multi-Layer Perceptrons (MLPs): An example of a feedforward network is the Multi-Layer Perceptron (MLP). Those values as Universal Function Approximators attest to its inherent richness, not only as an autonomous approach but also as a torchbearer of more evolved practices. For instance, WaveletMixer [82] adopts an MLP as a learning model to process bit-expensive time-series data. This encapsulates an important role for MLPs in modern finance: once we are done with the feature space from a temporal perspective, we are left with a non-trivial, dynamic, and non-linear structure that needs to be modeled. This flexibility can therefore be seen in the different types of applications in which it has been applied over time: from fundamental work in forecasting stock and exchange rates [83, 63] to more recent research on cryptocurrency price dynamics [80].
- Recurrent Neural Networks (RNNs): To address this and the time series component of financial data, one of the most revolutionary developments was that of Recurrent Neural Networks (RNN). RNNs differ from feedforward neural networks because they have a feedback structure, allowing the memory of the neuron’s internal state to be maintained. In theory, such a design can learn from sequential data effectively. However, this intuition is ruined by a severe and well-known problem: the vanishing gradient and exploding gradient. This makes classical RNNs so hard to learn long-range dependencies, which are crucial in financial markets. While some researchers remained unhappy and proposed enhancements, the net effect is that essentially nobody today uses these base RNNs for “main” forecasting. However, they provide a valuable basis for comparing more sophisticated algorithms (such as LSTMs or wavelet-hybrid methods) [84, 85].
- Long Short-Term Memory (LSTM) Networks: LSTM is ultimately the solution to the vanishing gradient problem in vanilla RNNs. Its power stems from a clever gating mechanism which a set of input, forget, and output gates that carefully manage which information is allowed to flow through the network’s memory cells. It is this architecture that endows LSTM with the ability to memorize useful information for a period of time, not only short ones, but even very long ones (and, in an ideal world, flush out useless noise in the data), a property that has made LSTM the workhorse model for forecasts of financial time series [86]. Accordingly, the literature is abundant with successful wavelet-LSTM hybrids, particularly due to their success across multiple disciplines, ranging from [87, 88], indices and trend prediction markets to commodity price computation [44]. They perform favorably in many comparative studies [89] and are a reliable, robust device for capturing the non-linear characteristics of markets.
- Gated Recurrent Units (GRUs): Inspired by the success of LSTMs, the Gated Recurrent Unit (GRU) emerged as a promising alternative, primarily for greater computational efficiency. It does so via a simplified architecture that merges the LSTM’s input and forget gates into a single “update gate,” thereby reducing the total parameter count. The surprising fact, as noted by [55, 90], is that GRUs generally perform quite similarly to LSTMs in terms of quality of results while requiring much less training time, an essential characteristic in practice [91]. This optimal mix of power and efficiency has positioned it as a preferred choice for recent wavelet hybrids. Recently, research demonstrated the superiority of SWT with optimized GRUs for Stock Prediction [6] and Bidirectional GRUs for volatility in assets like Bitcoin [80].
- Convolutional Neural Networks (CNNs): As opposed to the line-by-line manner in which RNNs solve the prediction problem, Convolutional Neural Networks (CNNs) adopt an entirely distinct strategy for modeling and predicting time series data, namely pattern recognition [92, 93]. Initially developed for image recognition, they work by using convolutional filters that serve as learnable detectors of specific shapes or patterns in the data. The underlying premise is that a time series of asset prices or other financial instruments can be considered as a 1D “image,” in which pattern repetition (similar to classical chart patterns) could have some forecasting property. Architectures such as SincNet are specifically designed to solve the task of signal classification [94]. This new paradigm has even led to the creation of image-like representations of financial data for example, heatmaps of a limit order book enabling the use of standard 2D CNNs for price prediction [95]. They also serve as strong feature extractors within more general hybrid systems, such as the CNN-SVM model introduced in [76].
- Graph Neural Networks (GNNs): One important direction to this end is that one should look beyond individual time series and model the whole market as a system with its feedback on itself and this is where Graph Neural Networks (GNNs) step in. Where they excel is in modeling intricate cross-asset dependencies such as supply chain relationships among firms, sentiment propagation within an industry, and competitive effects. For instance, the Multi-Modality Graph Neural Network (MAGNN) introduced by [91], is an excellent demonstration of the power in this. From that graph, along with others constructed from various data sources including historical prices, news sentiment, and industry knowledge graphs, the model can learn how information travels through the market network to predict more effectively but in a more nuanced manner.
- Probabilistic Neural Networks (PNNs): While many networks predict a specific future value (regression), predicting up or down is often more useful (classification). To achieve this, the Probabilistic Neural Networks (PNNs) have been a non-orthodox alternative. In the Bayesian framework, PNNs are trained to classify inputs into N discrete classes by producing probability density functions for each class. Pioneer work of [74] proved their capability by providing a strong prediction of the direction of three stock indices. This change of viewpoint is important because the direction you choose to align in is often the overwhelming determinant of performance for most trading systems.
- Quantile Regression Neural Networks (QRNNs): QRNNs, a type of feedforward neural network, can estimate nonlinear models at different quantiles. PSOQRNN, a particle swarm-optimized QRNN, has been proposed for forecasting financial time-series volatility [75].
- Deep Q-Networks (DQN): DQNs, which combine deep neural networks with Q-learning (a reinforcement learning algorithm), have been applied to financial applications, such as optimizing money management policies [84].
- Other Architectures: Dynamic Artificial Neural Networks (DANs) and General Regression Neural Networks (GRNNs) are also mentioned for stock market prediction and volatility forecasting respectively [75, 83]. Radial Basis Function (RBF) networks are another type used in exchange rate forecasting [63].
3.2. Wavelet-Transformer Hybrids
The gated RNN was indeed a significant advancement. However, the more recent use of the Transformer architecture, which originates from Natural Language Processing, represents a true breakthrough for time series forecasting [85]. Their pivotal advancement is the self-attention mechanism. Unlike recurrent neural networks (RNN) which process input sequentially, attention-based models can consider all previous data points at once. This ability is especially beneficial for modeling long-term, non-linear relationships typically found in financial data. Building on this, several time-series analysis Transformer-based models, such as Informer, Autoformer, and PatchTST, have been developed [51].
Wavelet analysis and Transformers is a unique and emerging area of study, as the attention mechanism allows for modeling complex financial signals at a higher level after wavelets decompose the signal into simpler components. This concept is simple, yet offers a powerful combination of signal decomposition and attention modeling. Researchers have attempted a variety of integration methods. Some models, for example, directly input wavelet-based multi-resolution features into the Transformer, which generates rich multi-resolution features [51]. Others, such as the SWIFT model, apply wavelets for down-sampling to reduce computational cost while preserving important signal attributes [45].
Nonetheless, progress has achieved several hurdles. The intricacy of dual structures increases the tendency toward overfitting, particularly due to noise in the financial environment. Also, their “black box” nature raises concerns about interpretability and transparency. This places a central paradox to the domain: the pursuit of top predictive precision against the practical need for reliable models that enable straightforward, sound explanations in high-risk financial scenarios.
4. PERFORMANCE EVALUATION AND APPLICATIONS
4.1. Common Performance Metrics
The evaluation of financial forecasting models, particularly those integrating wavelet analysis and machine learning, relies on a set of standard performance metrics. These metrics provide quantitative measures of a model’s accuracy, error magnitude, and classification ability. Understanding these metrics is crucial for comparing the efficacy of different hybrid approaches.
Commonly reported metrics in the reviewed literature include:
- Error Metrics (for regression tasks like price prediction):
- Root Mean Squared Error (RMSE): Measures the square root of the average of squared differences between predicted and actual values. It penalizes larger errors more heavily. Lower RMSE indicates better fit [2].
- Mean Absolute Error (MAE): Calculates the average of the absolute differences between predicted and actual values. It gives a direct measure of the average error magnitude. Lower MAE is preferable [2]. The error rate calculation
 used in the TRNN study is equivalent to MAE.
 - Mean Absolute Percentage Error (MAPE): Expresses the average absolute error as a percentage of the actual values. It helps compare forecast accuracy across time series with different scales. Lower MAPE indicates higher accuracy [44].
- Accuracy Metrics (for classification tasks like predicting price direction – up/down):
- Accuracy: The proportion of correct predictions (both true positives and true negatives) among the total number of cases. Higher accuracy is better [55].
- F1-Score: The harmonic mean of precision and recall. It is a valuable measure when dealing with imbalanced classes. A higher F1-Score indicates better classification performance [55].
- Area Under the ROC Curve (AUC): The AUC represents the model’s ability to distinguish between positive and negative classes. An AUC of 1 indicates a perfect classifier, while 0.5 suggests a random classifier. Higher AUC is better [55].
- Goodness-of-Fit Metrics:
- R-squared (R2): Represents the proportion of the variance in the dependent variable that is predictable from the independent variable(s). A higher R2 (closer to 1) indicates a better fit of the model to the data [55].
- Directional Accuracy / Hit Ratio: Specifically measures the percentage of times the model correctly predicts the direction of price movement (e.g., up or down), which is often more critical for trading decisions than the exact price forecast [69].
4.2. Benchmarking and Comparative Analysis
A central theme emerging from the reviewed literature is the enhanced efficacy of hybrid wavelet-ML models compared to their standalone counterparts or traditional statistical methods Table 2.
- Versus Standalone ML Models: Studies consistently demonstrate that integrating wavelet analysis as a preprocessing or feature-engineering step significantly improves ML model performance. For example, [16] showed that their DWT-ELM (DELM) model achieved substantially higher accuracy and AUC values in stock trend prediction compared to a standard ELM model trained on raw data. Similarly, [44] reported that a Wavelet-LSTM model achieved over a 30% gain in accuracy (reduction in error metrics) compared to a standalone LSTM model for forecasting spice prices. The research on the WT-Att-LSTM model for the NIFTY 50 index also found it outperformed an Attention-LSTM (without wavelets) and a basic LSTM model, with ablation studies confirming the positive contribution of wavelet denoising [55, 6] reported accuracy increases ranging from 15.89% to 19.59% for various stock indices when using their DWT-CSO feature engineering approach with ML/DL models compared to models without this wavelet-based feature processing.
- Versus Traditional Statistical Models: Wavelet-ML hybrid models also tend to outperform traditional time-series models such as ARIMA or GARCH. For instance, [80], whose stacked deep learning model incorporated wavelet denoising, found that their approach for Bitcoin forecasting outperformed ARIMA. The TRNN model, an optimized RNN with its own advanced time-domain preprocessing, was also shown to outperform ARIMA and GARCH models in stock price prediction [2].
The robust performance of wavelet–ML hybrid models over wavelet-less models supports the central hypothesis of this research domain, which asserts that resorting to wavelet transforms to address the problems of noise and non-stationarity in financial data is necessary for more precise forecasting. Wavelets improve signals and help construct richer, more informative features that ML models use to identify patterns and improve their generalization performance on novel datasets.
It is more than simply incorporating a better performing ML model. It is indicative of the value added from sophisticated layers of data abstraction and robust learning paradigms. The results show that the effectiveness of the used technique depends on the assumed preprocessing paradigm, thereby substantiating the notion that “the more sophisticated the data, the more sophisticated model one is required to use,” which comes from the domain of learning from data.
Table 2. Comparative summary table.
| Reviewed Method/Model | Dataset Used | Key Performance Metrics Reported (Value) | Notes on Computational Cost |
| Discrete Wavelet Transform [41]. | Dow Jones Industrial Average (DJIA30) | Autocorrelation Function (ACF) measures the stationarity and “noisiness” of the data after the DWT is applied. | – |
| BSd-RNN. [42] | Monthly historical volatility (HV) from S&P 500, NASDAQ, DJIA, and NYSE. | FRMSE: 0.0022 FMAE: 0.0012 FMAPE: 0.0231 | B-spline wavelets use matrices that enable linear algorithms, increasing the model’s efficiency. |
| Wavelet Deep average model. [43] | Bitcoin (BTC), Dogecoin, Ethereum (ETH), and Bitcoin Cash (BCH) | Price prediction was an MAE of 1.19. illiquidity prediction was an MAE of 1.49. | The model was implemented using the Keras library with a TensorFlow backend. Specific network settings included a batch size of 64 and a learning rate of 0.0001. |
| Wavelet LSTM model. [44] | Monthly wholesale price data from various markets across India. | Root Mean Square Error (RMSE), Mean Absolute Percentage Error (MAPE), and Mean Absolute Error (MAE). Wavelet LSTM model gain in accuracy of more than 30% compared to the standard LSTM | significant limitation of wavelet-based denoising is that it can be computationally intensive. |
| SWIFT [45] | Traffic, Electricity, Weather, and four subsets of the ETT dataset | SWIFT achieved an MSE of 0.0129, significantly outperforming models like FITS (0.0376) and Transformer (0.0384) | The SWIFT-Linear variant has only 18.1k parameters, which is 4 times fewer than a standard single-layer linear model and roughly 15% of the parameters of another lightweight model, FITS. |
| This is a comparative analysis paper that uses the Haar Wavelet and the Daubechies Wavelet [40]. | S&P GREEN BND SELECT INDEX – PRICE INDEX | Energy Distribution: 85.51% Entropy Coefficients: 0.6231 | Haar wavelet as “a straightforward and effective wavelet” , Daubechies wavelet as “a more sophisticated wavelet with more smoothness and accuracy” |
| Non-Decimated Wavelet Transform (NDWT) and Non-Decimated Wavelet Packet Transform (NWPT) [51] | UK National Grid electricity supply,Hourly measurements from Heathrow, Simulated Data | Primary evaluation metric is the Symmetric Mean Absolute Percentage Error (SMAPE), NDWT features led to a 31% reduction in SMAPE for Multilayer Perceptron (MLP) models and an 11% reduction for XGBoost models | Approximately 140 hours to run on a computer with an Intel i9-9920X CPU and an NVIDIA GeForce RTX 3080 Ti GPU. |
| Hybrid ARIMA-wavelet [52] | USA monthly electricity demand data | RMSE decreased by 24.6%. MAE decreased by 23.7%. MAPE decreased by 23.5%. | Sigma XL and MATLAB software. |
| The study evaluates several machine learning models: Gradient Boosting Machine (GBM) with Bayesian Optimization, LSTM, and Autoencoder [55] | Historical financial and operational data from a manufacturing firm | Cost Estimation: MAPE (4.9%) Financial Forecasting: sMAPE (7.9%) | Training times for its best-performing models: 7.10 seconds for the hybrid GBM model and 5.78 seconds for the LSTM model. |
| Time-series Recurrent Neural Network (TRNN)dependencies [2]. | Dow Jones Index | Prediction Error Rate: TRNN: 9.23% LSTM: 14.4% ARIMA: 15.54% RNN: 16.4% GARCH: 37.63% | 2.8 GHz Intel Core i7-1165 CPU and 32 GB of RAM. The programs were written in C# and Python 3.7, using TensorFlow 1.13.1. |
| EWT-attention-LSTM [73] | Case 1: Monthly industrial electricity consumption in Hubei Province, China Case 2: Monthly total electricity consumption of China Case 3: Monthly petroleum products consumption of the United States | MAPE values for the proposed EWT-attention-LSTM model: Case 1 (Hubei Electricity): 4.01%. Case 2 (China Electricity): 5.37%. Case 3 (US Petroleum): 1.60%. | For all experiments, the models used data from the previous three months (t-3) to forecast the target variable for the current month (t). |
| DELM (Denoised Extreme Learning Machine) [88] | Study used a dataset of 400 stocks from the Shanghai and Shenzhen stock markets in China. | Accuracy (Acc): 0.7013 AUC: 0.6892 Precision (P): 0.6681 F1 Score: 0.6369 Recall (R): 0.6257 | Efficiency of the Extreme Learning Machine (ELM) component, noting its fast convergence and learning speed compared to traditional gradient-based algorithms like backpropagation. |
| Multi-layer Perceptron (MLP), Convolutional Neural Network (CNN), and Long Short-Term Memory (LSTM) [87]. | 10-year (2009–2019) daily adjusted stock price data for four major US companies: Coca-Cola, Cisco Systems, Nike, and Goldman Sachs. | Primary metric used was the Area Under ROC Curve (AUC) to account for class imbalance. LSTM model achieved an AUC of almost 0.85 on the Cisco Systems data. | The paper notes a trade-off between performance and efficiency’s model produced superior results but is described as a “computationally expensive algorithm that requires a long time to train”. |
| WT-Att-LSTM [55]. | Daily data from the NIFTY 50 index | RMSE (Root Mean Squared Error): 0.0302 MAE (Mean Absolute Error): 0.0234 R² (R-squared): 0.9777 | The paper focuses on the model’s architecture and predictive accuracy. It does not provide specific details on the computational cost, training time, or overall efficiency of the WT-Att-LSTM model. |
| Multi-modality Graph Neural Network (MAGNN) [91] | All 3714 public companies in the China A-shares market | Weighted-F1: 0.4825 Micro-F1: 0.4838 Macro-F1: 0.4627 | The MAGNN model, written in TensorFlow, takes 2 hours to train on 2 Tesla P100 GPUs. |
| Artificial Neural Networks (ANN) and Support Vector Machines (SVM) [93] | Stock indices like NASDAQ, S&P 500, KOSPI, and NIFTY | ANN: Reported accuracy varies significantly across models and datasets. Some studies achieved accuracies of 98% and 96.22% (R² scores). More commonly, accuracy ranges between 68% and 90%. SVM: Simple SVM models typically show an accuracy of about 60%–70%. | SVM: Is noted to “fall short when dealing with large datasets” because it can require high computational power and be time-consuming to run. ANN: The primary time cost is not in running the model but in finding the optimal network configuration, which is described as a “trial and error game” that can be “tedious and periodically time-consuming”. |
| Deep stacking ensemble model [80] | Bitcoin (BTC) data sourced from bitinfocharts | Mean Absolute Percentage Error (MAPE) of 0.58% | Deep learning approaches tend to take longer to execute than traditional machine learning methods. |
| The study compares the performance of a simple Recurrent Neural Network (RNN) and its two main variants: Long Short-Term Memory (LSTM) and Gated Recurrent Unit (GRU) [94]. | Stock market indices and currency exchange rates | The models were evaluated using Root Mean Squared Error (RMSE) and Mean Absolute Error (MAE). The GRU model achieved the best overall performance. | The paper notes that the LSTM model has many parameters, which “requires a large computational power, making the data processing slow.” |
4.3. Applications Across Diverse Financial Markets
The application of hybrid wavelet-ML models spans a wide range of financial markets and forecasting tasks, demonstrating the approach’s versatility.
- Stock Market Forecasting:
- Prices and Indices: A considerable segment remains investment in propensity prediction of stock prices and stock market indices. This is represented by the WT-Att-LSTM model developed for the NIFTY 50 [55] and by the DWT-CSO model used for NIFTY50, BSE (India), S&P500, and DJI (US) indices [6], DWT-ELM for stock market trend forecasting [16, 92, 96, 97] and MRA-RNN for some U.S. stocks [10] and SWT-OGRU model for stocks of individual companies such as Apple and Netflix [6]. Also, wavelet-transform-based is the TRNN model [2], which has focused on the Dow Jones Index.
- Turning Points: Knowing when a market starts to rise and when it starts to fall is crucial for any trader. Wavelet analyses of these issues often involve decomposing the residuals of a forecasting system’s internal model to extract internal cyclical components. In a line of work now referenced in contemporary research, applied wavelet MRA to the US, UK, and China markets. More research has shown that DWT-based denoising can highlight the more stable trends, thereby assisting in the identification of turning points. The TRNN model integrates DNN-based turning point detection, as described by some researchers. Wavelet analysis in the context of stock markets is one of the most efficient methods for measuring instantaneous price changes and determining, in real time, the price fluctuations that activate the market. This is achieved by enhancing the clarity of the underlying trend components, which can be obscured by short-term noise [98]. By isolating these trends, wavelets can make it easier for models, and even for experts conducting visual analysis, to detect momentum shifts that often signal impending market reversals.
- Commodity Market Forecasting:
- The forecasting of commodity prices, including agricultural products and energy, has benefited from the integration of wavelet-ML. [44] demonstrated significant improvements in forecasting spice prices using a Wavelet-LSTM model. [56] proposed combining wavelet-based divergence measures with LSTMs to predict commodity prices under conditions of economic and financial uncertainty.
- Cryptocurrency Market Forecasting:
- The very volatile and noisy characteristics of cryptocurrency markets makes them a challenging but suitable environment for wavelet-ML applications. [8] applied Haar wavelet noise reduction to a stacked deep learning model (consisting of LSTMs, GRUs, and Transformers) for the prediction of Bitcoin prices and movement. [43] proposed WDA model to combine wavelet features (features selected through Random Forest) and simple averaging of the deep learning models to predict the prices and illiquidity of multiple sets of cryptocurrencies (BTC, Dogecoin, Ethereum, etc.). It is interesting to use wavelets in these markets, as traditional models may fail because of the extreme data properties. Wavelet denoising and advanced feature extraction are necessary to extract a discernible pattern from the highly stochastic nature of cryptocurrency price series. The findings in those papers show that wavelet-ML hybrids could be an exciting tool for navigating the maze of cryptocurrency forecasting, and, in the case of ripple, at least in stable, mature, less noisy traditional markets.
- Volatility Forecasting:
- Forecasting financial volatility is important for risk management and option pricing. Wavelet analysis has also been used by [71, 99, 100], employing wavelet entropy along with DL models to predict forex volatility. Other research describes a framework that integrates a Triple-Discriminator Generative Adversarial Network (GAN) with the Continuous Wavelet Transform (CWT) to decompose the volatility time series into signal-like and noise-like frequency components for independent monitoring and detection [101]. Due to wavelet decomposition of signals into various frequencies, wavelets can also directly help track and model volatility. The volatility itself is a multiscale, time-dependent phenomenon: it clusters, evolves, and behaves differently in the short-term and the long run. High-frequency detail coefficients in wavelet decomposition can equivalently refer to short-term volatility, and lower-frequency approximation constituent may indicate medium (long) term trends in volatility. As a consequence, wavelets offer a natural and practical approach to capturing the multi-scale nature of volatility and enable better modeling, potentially resulting in more accurate forecasts than models based solely on raw price returns.
5. CHALLENGES AND LIMITATIONS IN APPLYING WAVELET ANALYSIS WITH MACHINE LEARNING
Despite the promising results achieved by hybrid wavelet-ML models, their application in financial forecasting poses challenges and limitations. Addressing these is crucial for the continued advancement and practical adoption of these techniques.
5.1. Choice of Mother Wavelet
Determining the appropriate wavelet transform for financial time series analysis is a complex yet essential task in wavelet-based modeling [13]. Each of the mother wavelets, such as Haar, Daubechies, Symlets, and Coiflets, has its own symmetrical, mathematically distinctive properties of compact support and the number of vanishing moments. These traits impact the way a wavelet is able capture the features of the financial time series. Using the wrong wavelet can lead to insufficient decomposition, ineffective noise suppression, and insufficient feature extraction, which, in turn, negatively affect the subsequent machine learning model’s performance.
For instance, [44] explores the use of the Daubechies and Haar wavelets in forecasting agricultural prices, while [52] cross-validated to Daubechies configurations having different degrees of vanishing moments to optimize performance. These studies illustrate the absence of a single definitive criterion for selecting mother wavelets for financial datasets. Typically, selection is conducted on an ad hoc basis based on data smoothing, gaps, and the wavelet and signal processing literature, which often fails to capture the intricacies of financial time series.
5.2. Determining Optimal Decomposition Level
Decomposition levels in a wavelet transform are as important as the selection of the corresponding mother wavelet [44]. The decomposition level determines the level of detail in the multi-resolution analysis. With too few levels, important frequency components are more likely to be combined, making it harder to distinguish patterns from noise. With too many levels, excessive complexity, and the addition of spurious components, the wavelet transforms, especially the Wavelet Packet Transform (WPT), becomes problematic due to significantly higher computational costs.
In a previous study [44], it was determined that a decomposition level of H6 yielded the best results with the Haar wavelet and LSTM model. Other model–spice combinations, however, achieved optimal performance at different levels, such as H5 or H7. The growing need for parameter tuning and model validation is underscored by the need to adapt to the variety of datasets.
5.3. Selection of Thresholding Rules and Values for Denoising
The success of hybrid modeling depends on the efficiency of done in the wavelet transform denoising process. Which depends on two rules. One is the thresholding rules (hard, soft, Garrote), and the other is the method for computing the threshold (universal methods like VisuShrink and adaptive methods like SUREshrink) [55]. Failure of thresholding results in dire consequences. An extremely conservative threshold keeps the data too dirty, forcing the machine learning model to work on it. An aggressive threshold, on the other hand, leads to aggressive signal information extraction, resulting in the complete loss of vital financial features due to excessive overshooting.
A straightforward example is [16]. While many works used fixed threshold parameters, others claimed that, for the DWT-ELM model, such parameters do not perform well under varying data conditions [102].
5.4. Risk of Overfitting
This multitude of parameters, formed by selecting a wavelet’s mother, its decomposition levels, and its subsequent thresholding, along with training an ML model on the altered dataset, is sure to provide a wide range of options for constructing the model. This ease of construction, however, comes at a cost: an increased risk of overfitting. This, along with her concern about the wavelet-ML model in conjunction with machine learning, might make the model overly tailored to the training dataset. In the case above, the model might learn underlying trends and remove a portion of the overlying noise, hence the name “residual noise”. Thus, in the case where the model performs exceedingly well on in sampling and specific tests, the model is just trying to derive relationships between seen objects and fails in the case of the real world, a revelation that is unheard of in financial forecasting, is a testament to the level of over-fitting that has been done.
To combat this, steps such as rigorous cross-validation and overfitting-preventing mechanisms are key. This has been highlighted in the case of wavelets’ overfitting about the optimal number of wavelets selected via cross-validation [51]. In the end, the goal is to determine whether the noise and inherited characteristics of the chosen sample skew the model’s performance assessment in a way that does not reflect the actual complexities of the market and its underlying behavioral mechanisms [98].
5.5. Computational Cost and Practical Implementation
While implementing wavelet-based models, it is important to strike the right balance between model performance and computational cost. Various components contribute to the overall computational demand, including the chosen mother wavelet, the number of decomposition levels, and the size of the set under analysis. Generally, increasing the decomposition level provides a more granular analysis but also increases computation time and memory requirements. There are several accessible software libraries for implementing these methods. In Python, the PyWavelets library is the standard for wavelet transforms, offering a wide range of wavelet families and functions for decomposition and denoising. For MATLAB users, the Wavelet Toolbox™ provides a comprehensive graphical and command-line environment for analyzing, synthesizing, and processing signals.
CONCLUSION
Financial forecasting is an age-old problem and one of the most challenging for quantitative analysis, primarily because financial time series data are complex, with pervasive noise, non-stationarity, and non-linearity. In many situations, these complex patterns cannot be fully accounted for by classical statistical models. This paper collates an extensive body of peer-reviewed literature to show that the maturation of wavelet transforms with machine learning is indeed an important and inevitable paradigm shift across the field.
The primary conclusion is that the wavelet is not simply an addition to other analysis techniques; it is an independent, robust, and constructive approach to analysis that enriches the quality of financial data, particularly in effective feature denoising and multi-scale extraction. The application of the wavelet transform enables a sophisticated machine learning model, such as an LSTM or a Transformer, to work with a dataset that has been significantly structured, denoised, and information-rich [66, 67]. This is the rationale for the outperformance of such hybrid models relative to their individual components, and the superior predictive performance has been attributed to the enhanced data representation. This thesis demonstrates the versatility and effectiveness of this model across markets ranging from simple stocks to chaotic cryptocurrencies.
Despite the positive outcomes of hybrid models, their actual use is still hampered by problems. Selecting suitable parameters, such as the mother wavelet, decomposition level, and thresholding rules, remains very important and sometimes tedious, but crucial within the context of wavelet analysis. It is still dependent on the daily activity data, and forecasting becomes tedious within the other boundaries of wavelet analysis. Additionally, the complex nature of such systems is prone to overfitting, as with other deep learning models, which act as major hindrances to interpretability and confidence within institutions. Thus, the following steps should provide more transparent wavelet methods, along with other hybrids. This collection of papers is built on cornerstones that provide a controlled wavelet transform for predictive analysis. Deep learning systems, which provide a paradigm shift from traditional systems, are set as the powerful frontier.
The WT’s ability to decompose signals into different time-frequency scales at its heart provides a specific solution to the problematic aspects of financial time series, notably non-stationarity, ubiquitous noise, and volatility clustering [79, 89, 90]. The multiresolution analysis property of this can help develop two key application techniques essential to financial forecasting: efficient denoising of financial time series allows separation of the underlying model from random noise, and feature selection at multiple scales is obtained from wavelet coefficients.
The superior predictive performance of hybrid models which combine wavelet features with different machine learning and deep learning techniques has been consistently corroborated in the literature. This is not a trivial increase in performance. It also underscores the importance of the quality and representativeness of the input data. Noise reduction and structural clarification of data with wavelets enable machine learning models to work with less chaotic, more organized information. Consequently, these models are better at uncovering the actual patterns and intricacies of the data. This has been proven in several domains, including the denser domain of financial markets such as traditional stocks and cryptocurrencies where wavelet denoising makes pattern recognition more accessible, which would otherwise be difficult.
Although positive, such models have significant drawbacks. Parameter tuning of wavelet-based systems is not trivial. The numerous adjustable parameters in both the wavelet and the machine learning components present overfitting risks. Further, the already problematic interpretability of these models, due to the “black box” nature of complex systems, leads to distrust and non-adoption, especially in institutions. These challenges highlight the advanced but delicate position the field is in. There is an extreme need to fine-tune and expand the technical approaches to realize the next set of gains.
Future research, however, has already begun to branch into these more innovative, still untapped directions. We expect the next wave of breakthroughs to emerge from real-time adaptive wavelet techniques that select optimal parameters autonomously, as well as from the development of more understandable and robust hybrid models. Such achievements would both enhance the accuracy of these models and the confidence needed to deploy them in the intricate financial markets.
The literature highlights several possible ways to address the current shortcomings. One technique is the development of adaptive wavelet methods, in which the components of the financial time series, such as the mother wavelet, decomposition level, and thresholding hyperparameters, can change over time. This may improve adaptability, robustness, and the overall simplicity of the methods by eliminating the need for manual tuning. At the same time, other researchers are developing more complex hybrid models that incorporate new wavelet types and deeper architectures, such as Transformers and Graph Neural Networks. These works have to be complemented with new developments of interpretability, for instance by redesigning attention mechanisms to facilitate model explainability. This range of activities exemplifies a broader trend in AI, driven by the XAI and AutoML movements, to create models that are not only powerful but also reliable and explainable.
Licensed
© 2026 Copyright by the Authors.
Licensed as an open access article using a CC BY 4.0 license.