


Article Contents
Article ID: CM2601105005
Use of Wearable Devices to Detect Sedentary Behaviour in an Office Environment
 PDF
PDF
⬇ Downloads: 0
1School of Computing, Ulster University, Belfast Campus, BT151AP, United Kingdom
Received: 16 January, 2026
Accepted: 14 March, 2026
Revised: 27 February, 2026
Published: 28 March, 2026
Abstract:
Sedentary Behaviour (SB) is a significant public health problem, which is associated with chronic illness, poorer quality of life, and increased healthcare costs. Wearable devices like Fitbit provide the possibility of 24/7 objective activity monitoring and could be useful in the identification of sedentary behaviour in the general population. This study, however, analyzed a publicly available Kaggle Fitbit dataset, and it focused on classifying the activity levels and identifying office-based sedentary patterns using Machine Learning (ML) and Deep Learning (DL) approaches.
Five supervised ML models, such as Random Forest, Support Vector Machine, XGBoost, K-Nearest Neighbour, and Logistic Regression, were compared with two DL models, such as a feedforward neural network and Long Short-Term Memory (LSTM). Features obtained from daily activity, heart rate, and sleep were used as inputs, whereas the SHAP values were used to explain model predictions. Performance was measured in terms of accuracy, precision, recall, F1 score, and AUC. Stratified train-test splits and cross-validation ensured robustness.
The XGBoost achieved the best classification performance (accuracy 0.95, macro-F1 0.84), followed by the Random Forest. Logistic Regression (Accuracy 0.94, macro-F1 0.79). The feedforward neural network achieved moderate results (accuracy 0.93; macro-F1 0.70), and the LSTM underperformed (accuracy 0.62; macro-F1 0.47), which is typical of the difficulty in using sequence models on small, imbalanced data.
A Streamlit application was created to enable users to upload Fitbit CSV files, perform automated preprocessing, model selection, and predictions with confidence scores. It also produces daily summaries of sedentary instead of active time and offers SHAP-based explanations.
Keywords: Sedentary behaviour detection, wearable devices, physical activity monitoring, machine learning, deep learning, health informatics, human activity recognition.
1. INTRODUCTION
Sedentary behaviour (SB) is any waking activity that involves sitting, reclining, or lying that involves little energy expenditure (≤1.5 METs) [1], [26]. It is becoming an increasingly recognised serious cause of concern in public health, with prolonged SB associated with cardiovascular disease, obesity, musculoskeletal disorders, type 2 diabetes, some forms of cancer, and premature mortality. [2]-[5], [23]-[25], [27].
Modern office environments exacerbate this problem, as workers spend most of their working life in a seated position, and are contributing significantly to daily sedentary time [5], [7], [8], [62].
Early detection and regular monitoring of SB is the key to designing interventions and encouraging active lifestyles. Traditional methods, such as self-reports and observational studies, tend to have problems with recall bias, limited resolution, and scalability. In contrast, wearable devices such as Fitbit allow us to have continuous, objective, and fine-grained measures of activity, heart rate, and sleep in free-living conditions [6], [8], [9], [10], [31], [32].
Open datasets such as the Fitbit collection on Kaggle used for this paper enable the development and validation of ML and DL models for SB detection [9], [11]-[14], [67]. Prior research shows that multimodal features—combining activity, physiological, and sleep data—improve classification accuracy compared with step counts alone [11], [15], [16].
This paper introduces a comprehensive SB detection framework using the Kaggle Fitbit dataset. Five ML models are systematically compared with a TensorFlow-based DL model [9], [10], [17], [18], [70]. SHAP (Shapley Additive Explanation) values are employed to explain ML predictions, while the DL model captures more complex patterns. Performance is assessed with multiple evaluation metrics, and the models are deployed in a Streamlit application for real-time, user-friendly analysis of Fitbit CSV uploads.
The remainder of this paper is organised as follows: Section 2 reviews the literature related to the areas of the use of wearable devices and DL in Activity Recognition in the context of SB; Section 3 outlines the data used and the preprocessing; Section 4 details the proposed methodology; Section 5 presents the results obtained; Section 6 describes the application developed; and Section 7 concludes with recommendations for future research.
2. Literature Review
- Sedentary Behaviour: Definition, Risks, and Measurement Challenges
Sedentary Behaviour (SB) generally refers to waking activities that involve sitting, reclining, or lying down, with energy expenditure no greater than 1.5 METs [1], [26]. Spending long periods inactive has been linked to a range of health issues, such as heart disease, obesity, type 2 diabetes, musculoskeletal disorders, [2]-[5],[23]-[25], [27], [28], and a heightened risk of early death. In today’s office settings, extended sitting is widespread and plays a significant role in overall daily inactivity.
Conventional approaches, such as self-report surveys, suffer from recall bias and are subjective, whereas direct observation is time-consuming and impractical for use at scale [7], [8], [29], [30]. Objective device-based techniques, including accelerometers and inclinometers, make ongoing and dependable monitoring of posture and movement possible. However, these tools, which are often research-grade, are often costly and require specialised knowledge to process data. By comparison, consumer wearables such as Fitbit aim to provide a more accessible solution, one that is affordable, scalable, and reasonably accurate for monitoring in wide populations [31], [32].
- Wearable Devices and Fitbit in Sedentary Behaviour Detection
Devices such as Fitbit constantly collect all kinds of data, [31]-[33], [67]-[69], such as steps, heart rate, activity levels, and sleep patterns. Several studies have confirmed the accuracy of Fitbit in step detection [13], [14], [31], [33], and activity classification showing similar performance as research-grade accelerometers, hence confirming its suitability for large-scale research applications [8], [61], [62].
Boudet et al. [7] emphasised the importance of integrating various behavioural measures to obtain a more comprehensive picture of SB in workplace health studies. Similarly, Bongers et al. [8] determined that Fitbit was a reasonable and practical tool [12], [15], [67] for measuring SB over prolonged periods in the workplace. More recently, in their study, Wang et al. [9] also showed that step count data from Fitbit can be used effectively in Machine Learning models for classifying SB, and the results were similar and comparable with high-end accelerometers.
- Machine Learning Approaches to SB Classification
A variety of Machine Learning algorithms such as Random Forest, Support Vector Machines (SVMs), XGBoost, K-Nearest Neighbour (KNN), and Logistic Regression have been strongly employed in the analysis of data from wearable devices for the detection of sedentary behaviour (SB) [9]-[11], [40]-[42], [47]. These models do tend to work well when applied to structured data such as daily step counts, minutes of activity, heart rate readings, and sleep statistics.
Kantoch [10], who also reported on high accuracy in recognising SB using wearable sensors during Activities of Daily Living (ADLs), whose performance could further be improved by using Feature Engineering. Similarly, Papathomas et al. [11] have used gradient boosting on daily step count data, revealing the efficiency of lightweight models for the prediction of SB. In addition to accuracy in predictions, the interpretability of ML outputs is critical to their adoption in healthcare settings. Tools like SHAP facilitates to understand how individual features impact model predictions, which improves trust [50] and clinical applicability [65].
- Deep Learning in Activity Recognition and SB Detection
Deep Learning techniques can capture some meaningful patterns directly from raw or weakly processed wearable data, so they can capture complex relationships that might not be detected by traditional ML models [17], [18], [36]- [39], [46], [70], [72]. Models such as Convolutional Neural Networks (CNNs) and Long Short-Term Memory (LSTMs) networks have given a powerful performance in recognising human activity, including the recognition of Sedentary Behaviour.
Plotz et al. [17], [36], [37] carried out an extensive comparison of deep, convolutional, and recurrent models using wearable sensor datasets, coupled with their superior performance with respect to conventional ML approaches. Similarly, Zhao et al. applied a deep residual bidirectional LSTM for wearable sensor data [18], [70] which exhibited the enhanced ability in capturing temporal patterns. In particular, these results highlight the usefulness of DL models for Fitbit data analysis in SB detection [37], [72], particularly for time-series and high-dimensional inputs.
- Research Gaps
Despite progress in detecting Sedentary Behaviour, several key challenges persist:
(i) Multimodal integration: Most of the research has been conducted by focusing on step count data, and many other useful data, such as heart rate and sleep pattern [9], [11], [15], [16], are ignored.
(ii) Direct ML–DL comparisons: There is a lack of direct comparisons between traditional ML models and DL techniques on the same Fitbit dataset and its advantages [9], [11], [17].
(iii) Practical deployment: Most existing research is still contained within controlled environments, with very few attempts at creating practical tools for everyday use. To overcome this gap, this research presents a Streamlit-based framework that is designed to be deployed in the real world [24], [66], [73].
(iv) Office-centric applications: Very few studies have focused specifically on sedentary behaviours in the office environment, even though this is of great relevance to workplace health [5], [7], [62].
3. Methodology
- Dataset Description
The study was based on a publicly available dataset of Fitbit data from Kaggle [9], [12], [13], which includes activity tracker data of 30 participants over two months. The dataset is made up of the following components:
(i) dailyActivity_merged.csv – contains daily summaries, including steps taken, distances travelled, active minutes, sedentary minutes, and calories burned.
(ii) sleepDay_merged.csv – contains sleep-related metrics, such as the number of sleep records, total minutes asleep, and total time spent in bed.
(iii) heartrate_seconds_merged.csv – includes second-by-second heart rate measurements, and this will allow for detailed analysis of the cardiovascular activity.
(iv) minuteStepsNarrow_merged.csv – this logs step counts every minute, allowing the average steps per minute to be calculated.
- Data Preprocessing and Integration
The Fitbit data set was cleaned and integrated in a step-by-step manner. Date formats were standardised, and files were merged using the date field ActivityDate to provide consistency between the activity, heart rate, sleep, and step records.
Feature Engineering was then used to help with a more meaningful analysis. For heart rate data, the following statistical measures were computed as a measure of general cardiovascular activity: daily average (AvgHeartRate). Step data were aggregated to obtain daily average steps per minute (AvgStepsPerMinute), which is thought to be an intensity measure of activity. Sleep-related aspects were also extracted, such as the total number of sleep data (TotalSleepRecords), total minutes asleep (TotalMinutesAsleep), and total time in bed (TotalTimeInBed), to offer information on rest and recovery.
Missing activity entries were replaced with zeros, in line with common practices in wearable data analysis. The final set of features included: TotalSteps, TotalDistance, TrackerDistance, LoggedActivitiesDistance, VeryActiveDistance, ModeratelyActiveDistance, LightActiveDistance, SedentaryActiveDistance, VeryActiveMinutes, FairlyActiveMinutes, LightlyActiveMinutes, Calories, TotalSleepRecords, TotalMinutesAsleep, TotalTimeInBed, AvgHeartRate, and AvgStepsPerMinute.
Although the original dataset contained the SedentaryMinutes column, it was used solely to create class labels for sedentary and active days (see Section 3.3). To avoid label leakage, it was excluded from the predictor set during model training.
This research involved an iterative, Agile-inspired development lifecycle [73]. Each cycle included a literature study, data cleaning, model training, evaluation and reflection. A Kanban board was used to plan and track progress, increasing flexibility and accountability throughout the project.
- Sedentary Behaviour Labelling
Labels for training the models were derived from the SedentaryMinutes field in the Fitbit daily activity file. Based on guidance from occupational health and epidemiology, [19]-[23], [24], [60] a threshold of 600 minutes (10 hours) of daily sedentary time was used. Days with SedentaryMinutes ≥ 600 were labelled as sedentary (class = 1), whereas days with values below this threshold were labelled as active (class = 0).
This cut-off is in line with evidence from other studies. Koster et al. [19] reported that estimates of sedentary time using activPAL and ActiGraph devices usually converged at about 8 to 10 hours per day. Similarly, Rowlands et al. [20] found good agreement with activPAL reference standards using similar thresholds in free-living conditions. Kerr et al. [21] also showed that sedentary postures classified using hip-worn accelerometers were reliably identified at a rate of around 10 hours per day. In addition, public health guidance, including that of the UK Chief Medical Officers [60], identifies prolonged sitting (beyond 8 to 10 hours per day) as a critical risk factor for adverse health outcomes.
Using the 600-minute threshold helped align the study’s labelling approach with both research findings and public health advice. To avoid label leakage, the SedentaryMinutes column was not included in the feature set during training, helping to maintain the integrity of both ML and DL models.
- Machine Learning Models
This study implemented 5 supervised Machine Learning algorithms with a selection of algorithms based on their success in prior research of Human Activity Recognition (HAR) and Sedentary Behaviour detection. [40]- [42], [47] The Models included Random Forest (RF), Support Vector Machine (SVM), XGBoost, K-Nearest Neighbour (KNN), and Logistic Regression (LR). Collectively, these models represent several classes of methods such as ensemble learning, kernel methods, instance-based methods, and linear classifiers.
The hyperparameters of each model were optimised with grid search and cross-validation to ensure that you can select settings based on real performance instead of guesswork. This systematic process of tuning helped in mitigating overfitting and improving generalisability to unseen data. In order to improve the model’s interpretability, SHAP (Shapley Additive Explanations) was used to obtain feature-level insight into model predictions [50]-[53], [65]. Combining predictive modelling with explainability. The goal of the study was not only to evaluate how well the model was performing, but to build transparency and trust, which are two critical factors when applying ML in healthcare.
- Deep Learning Model
In addition to the machine learning models, two Deep Learning (DL) architectures were implemented using the TensorFlow/Keras framework. The first was a fully connected feed-forward neural network, [43]-[46], [48], [49], to classify sedentary and active days according to daily Fitbit features. The network had an input layer with 18 features, two hidden layers using ReLU activation functions to capture non-linear relationships. To reduce overfitting, dropout regularisation was used, while early stopping was used to stop training when validation performance started to plateau. The output layer made use of a sigmoid activation function for a binary classification, and a model optimiser (Adam optimiser) and binary cross-entropy loss were used to optimise the model.
To capture temporal patterns, the Long Short-Term Memory (LSTM) network is used to model the sequential nature of the Fitbit data at the minute level. The architecture consisted of an input layer using masking (to take care of padded time steps), a 64-unit LSTM layer using dropout and recurrent dropout. A dense layer using ReLU activation was used to feed the final output sigmoid layer. Training included class weighting to cope with the class imbalance, [57]-[59], as well as early stopping and learning rate reduction callbacks for improved convergence stability.
Evaluation of the LSTM showed that there was weaker performance compared to both the model using ML and the neural network with a dense layer. Although it obtained a relatively strong precision for active days (0.93), the accuracy for sedentary days was low (0.50), and the overall results were modest (Accuracy 62.2%, Macro F1 0.47, ROC-AUC 0.35). These results are a reflection of the challenges of working with temporal DL models using small, imbalanced Fitbit datasets, pointing out the need for larger datasets or more sophisticated designs, such as transfer learning or concatenated CNN-LSTM designs, to better capture patterns in real-world activities [37], [39], [70], [72].
- Tools and Environments
All experiments were implemented in Python 3.10 [47]-[49], using the following libraries: pandas, NumPy, scikit-learn, XGBoost, TensorFlow, Keras, and SHAP. The Matplotlib and seaborn libraries were used for visualisation. GitHub was employed for version control, and Streamlit served as the deployment framework for the final application.
- Evaluation Metrics
Model performance was evaluated using a variety of metrics that indicate both overall accuracy and the accuracy for each class. Accuracy was a general indicator of predictive performance, and the Receiver Operating Characteristic-Area Under the Curve (ROC-AUC) was used to provide a threshold-independent measure of class discrimination between sedentary and active days [54], [55], [56]. To account for class imbalance, precision, recall, and F1-score were also reported. Precision measured the number of correct instances of sedentary or active days out of all instances predicted, while recall measured the number of correct instances out of all instances making up the actual class. The F1-score, which is the harmonic mean of the precision and recall, was especially useful to characterize the tradeoff between the two scores.
To promote robustness, hyperparameter tuning for the ML models used k-fold cross-validation [54], [56], and minimised the risk of overfitting to any individual partition of the data. For the last evaluation, the data set was split into training (80%) and testing (20%) data sets stratified by class to maintain the same distribution of sedentary and active days in the original data. This two-step approach, which used cross-validation for tuning and stratified hold-out testing for final evaluation, helped to produce results that were both dependable and applicable beyond the training data.
- Application Deployment
To demonstrate the practical use of the framework, a web-based application was created with Streamlit, which offers a simple interface for non-technical users. Users can upload raw Fitbit CSV files, which are automatically cleaned and formatted by the system to fit the workflow for the prediction. This makes the process simple for the user, as no technical steps are needed for simplistic preprocessing. The greatest advantage is that it eliminates common formatting errors, and the data is uniform before entering it into the model. However, if someone submits highly customised or incomplete Fitbit exports, they may require some lesser adjustments to be done by hand, which is a practical limitation of using user-provided files. They can then select between Machine Learning and Deep Learning models for generating the predictions, with each prediction accompanied by a confidence score that indicates the certainty of the model.
For more transparency, the application includes SHAP-based explanations, which can reveal how individual features impact each prediction. In addition, the system produces visual charts to display daily activity patterns as well as classify behaviour into sedentary or active categories. A very unique property of the tool is that it gives per day summaries, reporting the percentage of sedentary versus active behaviour and giving a good interpretation, such as “70% sedentary, 30% active — overall sedentary day” or “80% active, 20% sedentary — overall active day.” These outputs both support personal health tracking and workplace wellness efforts with insights that are easy to interpret and apply.
Crucially, this application helps cover a major gap found in the literature and, in particular, the lack of practical tools to monitor Sedentary Behaviour in real-world settings. By creating a bridge between academic knowledge and practical tools, the system has demonstrated the possibility of using the data received from wearable technology at the consumer level for large-scale health monitoring. The combination of accurate classification, interpretability, and user-centred design is representative of the possibilities associated with the integration of ML techniques and wearable technology in the Sedentary Behaviour management in office-based environments in a manner that is evidence-based.
- Ethical and Professional Considerations
The dataset used for this research from Fitbit was fully anonymised and publicly accessible in accordance with the GDPR and guidelines and ethics for research. No personal information was collected or shared. To prevent the leaking of the labels, the SedentaryMinutes feature was excluded from the predictor variables. From the social perspective, the work encourages awareness of well-being without being intrusive, and the use of consumer-grade devices guarantees a sustainable and low-cost solution.
- Results and Discussion
- Model Performance
Table 1 shows the comparative performance of all the models implemented. We have five Machine Learning models, a fully connected Deep Neural Network (DNN), and a Long Short-Term Memory (LSTM) model. The evaluation metrics show trade-offs between overall accuracy, macro-averaged F1, weighted F1, and class-specific scores.
Table 1. Model comparison highlights.
Model | Accuracy | MacroF1 | Weighted F1 | Class 0 Precision | Class 0 Recall | Class0_F1 | Class1_F1 | CV Mean F1 | CV Std | ROC_AUC |
XGBoost | 0.95 | 0.84 | 0.95 | 0.83 | 0.6 | 0.7 | 0.97 | 0.828 | 0.032 | N/A |
Random Forest | 0.94 | 0.79 | 0.94 | 0.76 | 0.52 | 0.62 | 0.97 | 0.772 | 0.028 | N/A |
KNN (scaled) | 0.94 | 0.72 | 0.92 | 0.69 | 0.36 | 0.47 | 0.96 | 0.703 | 0.026 | N/A |
SVM (scaled) | 0.94 | 0.7 | 0.92 | 1.0 | 0.28 | 0.44 | 0.97 | 0.775 | 0.03 | N/A |
TensorFlow (DL) | 0.929 | 0.7 | 0.92 | 0.73 | 0.32 | 0.44 | 0.96 | N/A | N/A | 0.654 |
Log Reg (scaled) | 0.82 | 0.66 | 0.85 | 0.3 | 0.72 | 0.42 | 0.9s | 0.616 | 0.024 | N/A |
LSTM (DL) | 0.622 | 0.472 | 0.704 | 0.12 | 0.5 | 0.19 | 0.75 | N/A | N/A | 0.348 |
- Visual Analysis
Fig. (2) sorts the overall accuracy, macro-F1, and weighted-F1 score for each machine learning and deep learning model. XGBoost, Random Forest, and KNN (scaled) seem fairly consistently good and balanced in all three of these metrics, indicating good and balanced classification. By contrast, Logistic Regression and LSTM have very low values for the macro-f1, which supposedly suggests an issue with class imbalance. The strong correlation between the accuracy and the weighted-F1 values indicates that the high performance is largely compensated for by the performance of the majority class.
Fig. (3) focuses on the Class-0 (sedentary=minority) metrics; we display the precision, recall, and F1 for each model. It emphasises the challenge models have to identify the minority class. SVM (scaled) has a perfect recall (1.00) for Class-0, but has a very low precision, meaning that a lot of false positives appear. XGBoost and Random Forest are better overall balance with increased F1 for Class-0. The deep learning models (Dense NN and LSTM) have a much weaker performance for the minority class, which proves they are more sensitive to the class imbalance.
(Fig. 4). Weighted-F1 scores provide a more realistic view of the performance of each model for each class, considering the distribution of classes. XGBoost, Random Forest, and KNN (scaled) come on top once again with values greater than 0.95. These results have proven their strength and the ability to preserve the performance even with the uneven class frequency. Logistic Regression and LSTM are further down the list, with the LSTM model being the lowest performing out of all the algorithms reviewed in this metric.
(Fig. 5) compares ROC-AUC scores for all models. The Random Forest and KNN models achieve the highest ROC-AUC (1.00), indicating near-perfect separation between the two classes. SVM also performs strongly, followed by XGBoost and Logistic Regression. Deep learning models show comparatively weaker performance, with Dense NN achieving a moderate ROC-AUC (0.65) and LSTM the lowest (0.35). These results confirm that tree-based models remain the most effective for this dataset and task.
(Fig. 6) Cross-validation results showing the mean macro F1-score (± standard deviation) across machine learning models. XGBoost achieved the highest mean performance (0.828) [40], [41], [9], [11], [16], followed by Random Forest (0.772) and SVM (0.775). KNN performed moderately (0.703), while Logistic Regression showed the lowest macro F1 (0.616). Error bars indicate variability across folds.
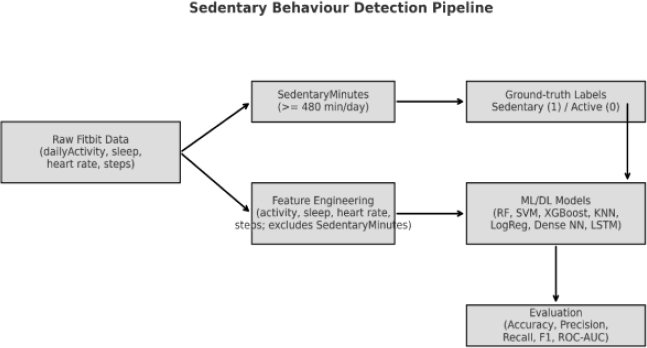
Fig. (1). Pipeline for Sedentary Behaviour detection using Fitbit data, Feature Engineering, ML/DL models, and evaluation metrics.
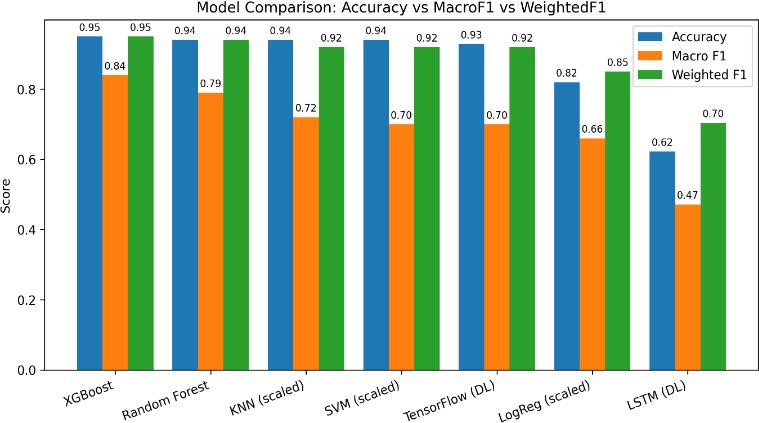
Fig. (2). Accuracy vs Macro‑F1 (All models).
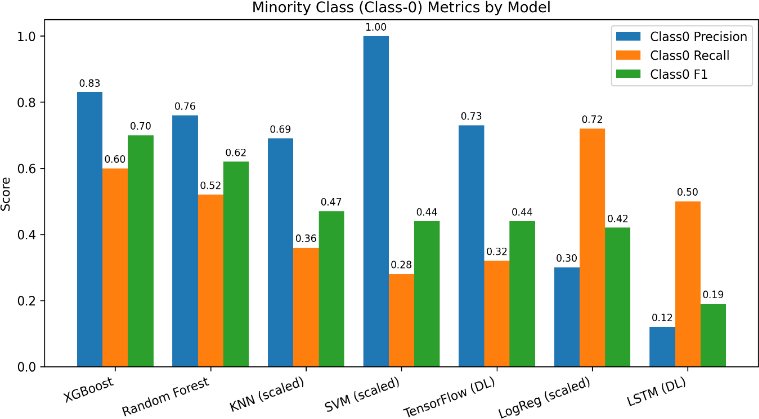
Fig. (3). Minority‑class (Class‑0) recall by model.
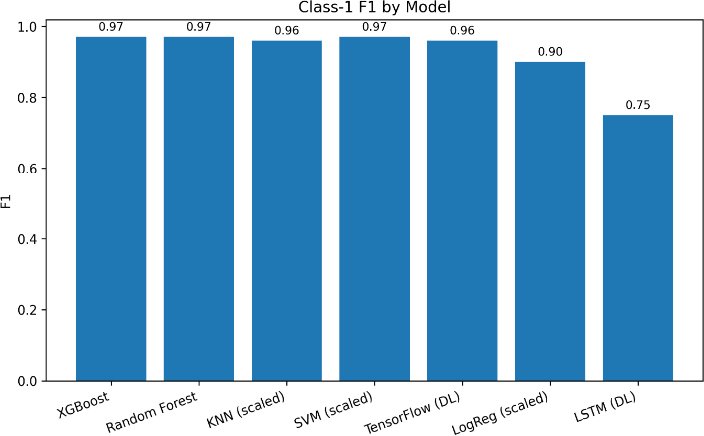
Fig. (4). Weighted‑F1 by model.
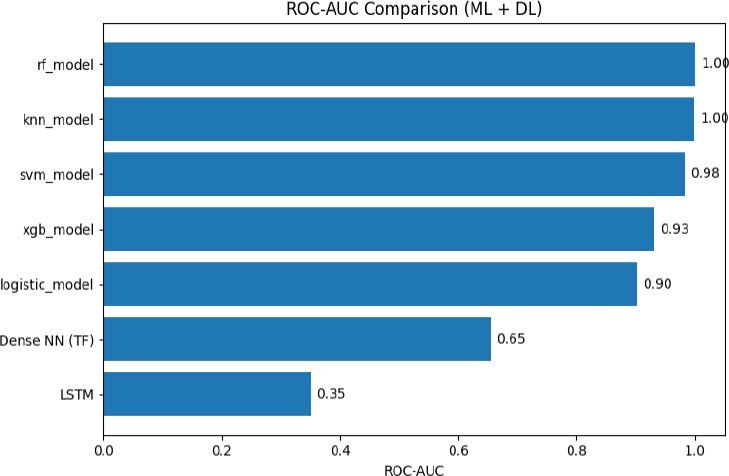
Fig. (5). ROC‑AUC ML and DL Comparison.
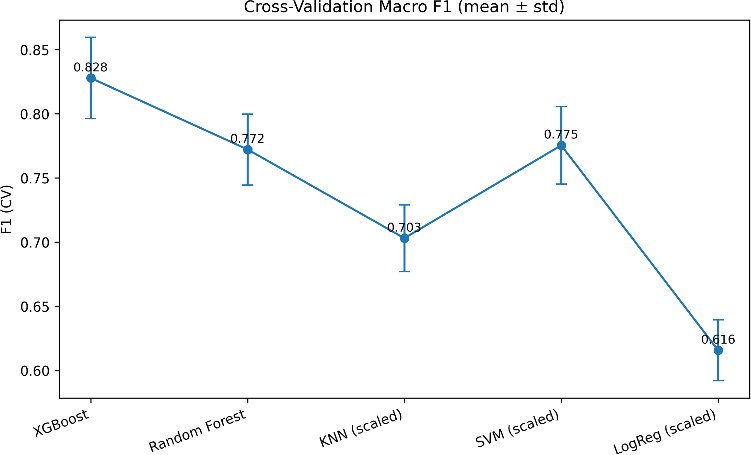
Fig. (6). Cross-validation macro F1-scores (mean ± standard deviation).
5. Discussion
Among the models evaluated, XGBoost showed the best overall performance with an accuracy of 0.95 and a Macro F1-score of 0.84. Random Forest closely followed (accuracy 0.94, Macro F1 0.79), confirming the robustness of ensemble techniques for multimodal data from Fitbit. Logistic Regression, although less accurate overall (0.82), had the highest recall for sedentary days (0.72), so it can use cases where sensitivity to Sedentary Behaviour are high priority. However, due to its low precision (0.30), it generated a lot of false positives, which is limiting for achieving reliable results for balanced classification.
The dense neural network model trained using TensorFlow showed similar performance with SVM and KNN in terms of Macro F1-scores (0.70-0.72) and a ROC-AUC (0.65), representative of moderate discriminatory power. In comparison, the LSTM, which was designed to include temporal dependencies in minute-level data, lagged far behind. It was 0.62 accurate, 0.47 Macro F1-score, and 0.35 of ROC-AUC. While the classification of active days was relatively good (F1-score 0.75), for sedentary days, the performance of the measure was poor, with a precision of 0.12 and an F1 score of 0.19. This raises the possibility that LSTM effectiveness was limited by limited data, class imbalances, and the problems associated with sequence padding.
Overall, the results suggest that deep sequence models do not show clear benefits on small, imbalanced wearable datasets [18], [39], [70]. By contrast, tree-based ensemble methods like XGBoost and Random Forest proved to be more resilient, with greater tolerance to sparse temporal data as well as skewed class distributions.
Class imbalance became a key factor in determining results [57]-[59]. Some approaches are suggested to improve sedentary-day detection, including class weighting, threshold adjustment, and synthetic re-sampling (e.g., SMote) [57]-[59]. These outcomes address the gaps identified in Section 2.5 with the benefits of the multimodal integration through providing one of the first direct ML-DL comparisons on a unified Fitbit dataset while providing a practical deployment-ready Streamlit tool to bridge research and practical use [24], [66], [73].
- Lessons Learnt (Critical Reflection)
A major problem during experimentation was label leakage, or getting the SedentaryMinutes column included as a predictor as well, meaning inflated results (100% accuracy). Once it was removed, genuine results were attained (95% accuracy). This illustrated the importance of feature validation and strict data auditing. Additionally, challenges with the minority sedentary class, where an imbalance was observed, caused effects on recall performance in some models. [57]-[59]
- Comparative Analysis with Previous Studies
Table 2. Selected prior studies vs. this work.
Study (Year) | Source | Task & Granularity | Metric (Value) | Notes |
Kańtoch (2018) [10] | Smart shirt (accelerometer + sensors) — PubMed | Sedentary recognition during ADL (episode-level) | Accuracy ≈95% ± 2.1% | Six ML classifiers; elderly-safe protocol; some free-living |
Koster et al. (2016) [24] | Hip/wrist ActiGraph vs activPAL — PMC | Sedentary time via accelerometer cut-points (minute-level) | AUC ≈0.85–0.89 | Hip <22 cpm optimal; wrist VM ≈1853–2303 cpm; activPAL criterion |
Rowlands et al. (2014) [22] | Wrist (Sedentary Sphere) — PubMed | Posture/sedentary classification (minute-level) | Agreement ≈85% ± 7% with activPAL | Free-living + lab; posture emphasis |
Kerr et al. (2018) [23] | Hip-worn accelerometer + ML — PMC | Posture & transitions (5-s epochs) | Sitting ≈67% accuracy (other classes 51–77%) | Free-living training; transitions are hardest |
Papathomas et al. (2021, EMBC) [11] | Daily steps (Fitbit) — Paperhost | Predict next-day sedentary (day-level) | Accuracy ≈82.1% (sens 0.75; spec 0.86) | Ensemble best; multi-subject test; unseen users ≈77% accuracy |
This work (2025) | Fitbit daily features | Detect sedentary day (day-level) | Accuracy 0.95; Macro-F1 0.84 (XGBoost) | RF close behind; DL accuracy ≈0.93; class-imbalance discussed |
The comparative evaluation confirmed that XGBoost had a well-rounded performance with 95% accuracy and a Macro F1-score equal to 0.84. [10], [11], [19]-[23], [24] Random Forest followed with a close performance (94% accuracy; Macro F1 0.79), reinforcing the strength of ensemble methods on modelling multimodal Fitbit data. Logistic Regression, whilst being less accurate overall, gave the best recall for the sedentary class (0.72), highlighting its usefulness if it were deemed sensible to prioritise sensitivity to Sedentary Behaviour. However, it was low in accuracy (0.30), which resulted in a lot of false positives. The dense neural network created using TensorFlow showed comparable performance to SVM and KNN, with Macro F1-scores of 0.70-0.72 and ROC-AUC of 0.65, which is medium discriminative ability. In contrast, the LSTM sequence model showed poor performance (62% accuracy; Macro F1 0.47; ROC-AUC 0.35), indicating the challenges associated with the use of temporal Deep Learning on small and imbalanced Fitbit datasets.
When compared with previous research, the results of this study are competitive and, in several cases, superior. Kańtoch [10] found the accuracy to be about 95% using wearable sensors during daily activities, and Koster et al. [24] found that the accuracy using ActiGraph and activPAL cut-point methods resulted in AUCs of 0.85-0.89, respectively. Rowlands et al. [22] reported a positive correlation of about 85% agreement with activPAL using the Sedentary Sphere method of wrist monitoring, and Kerr et al. [21] stated sitting classification accuracy of about 67% with hip-worn accelerometers. More recently, Papathomas et al. [11] used Fitbit step counts with an accuracy of 82% in predicting Sedentary Behaviour. In comparison, the XGBoost model in the present study overcomes previous Fitbit-based approaches and approaches laboratory benchmarks on sensors, which indicates that consumer wearables combined with advanced ML can offer robust and scalable solutions for Sedentary Behaviour detection in office environments.
- Extended Visual Analysis
Further analyses using TensorBoard confirmed that the Dense Neural Network achieved stable learning with validation accuracy plateauing around 94%. In contrast, the LSTM model exhibited overfitting due to data imbalance. Extended confusion matrices, ROC, and precision-recall curves for each model are provided in the supplementary materials.
(Fig. 7) Training and validation accuracy and loss curves for the Dense Neural Network, showing stable convergence with minimal overfitting, with training and validation accuracy improving over time, and both loss curves gradually decreasing. The similarity between training and validation trends suggests stable learning with minimal overfitting.
(Fig. 8) illustrates unstable learning behaviour in the LSTM model. Accuracy fluctuates sharply across epochs, and both training and validation loss show noticeable variability. This indicates difficulty in model convergence and highlights the challenges of applying LSTM to limited or non-sequential Fitbit data.
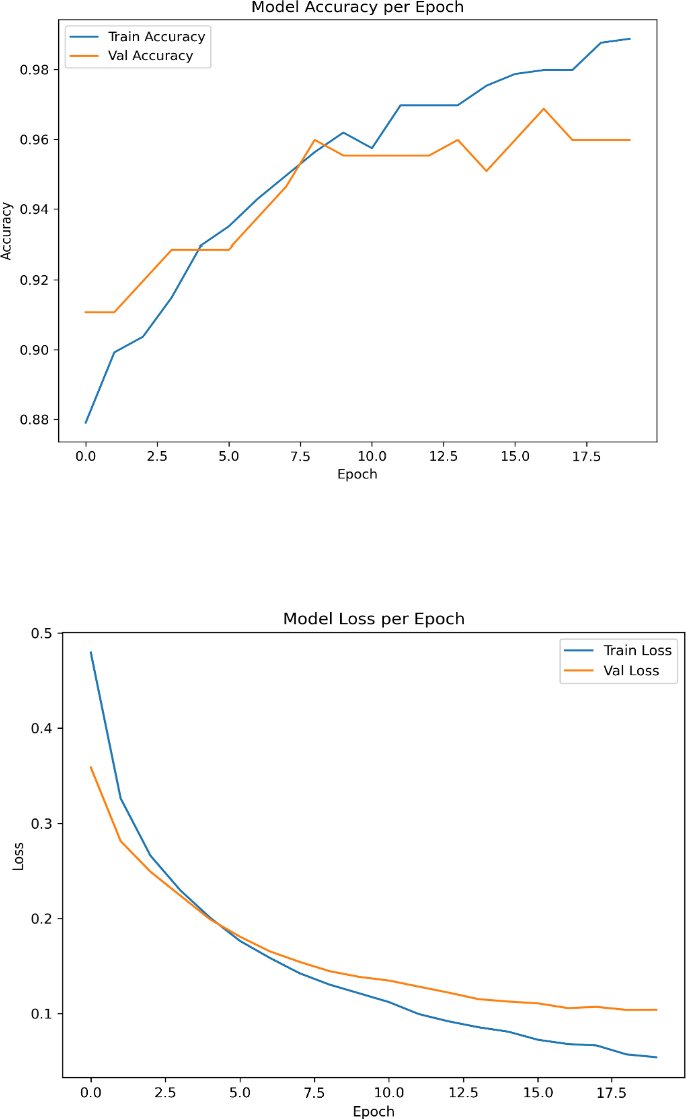
Fig. (7). Training and validation curves (accuracy and loss) for Dense Neural Network.
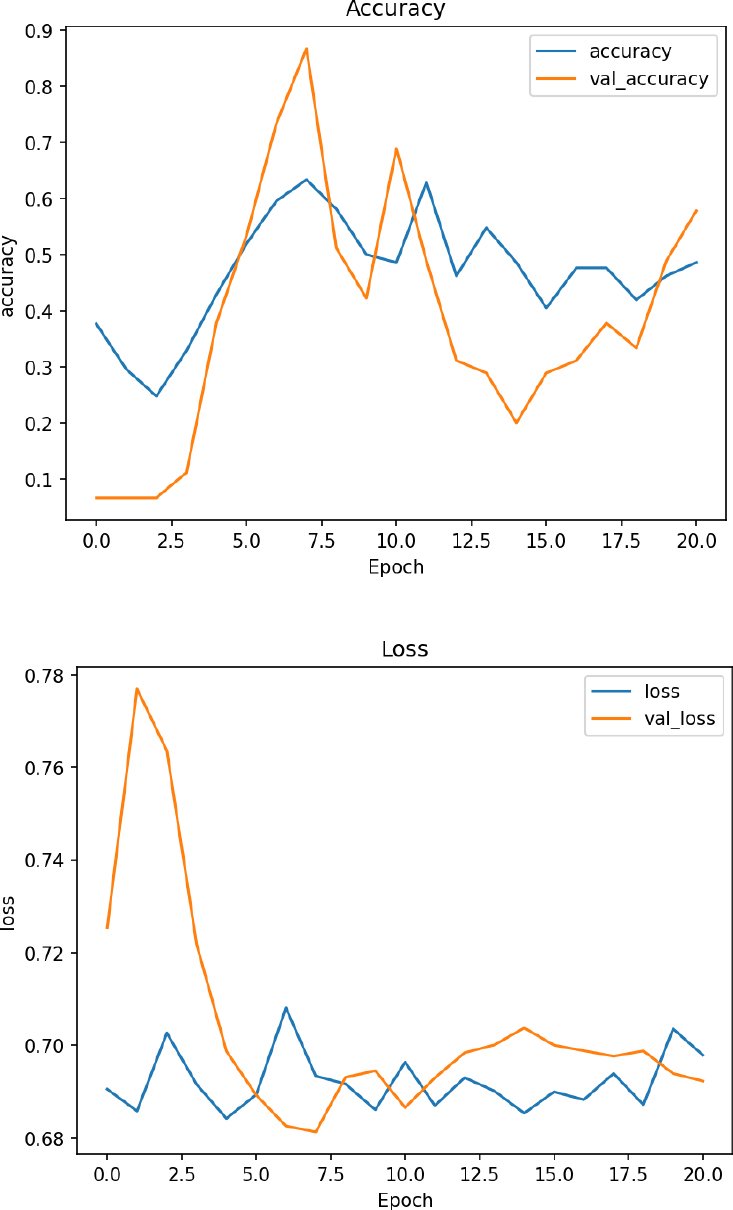
Fig. (8). Training and validation curves (accuracy and loss) for the LSTM model.
Conclusion
This study was a full-fledged Sedentary Behaviour detection process proposed from multimodal Fitbit data. Five supervised Machine Learning models were compared to two Deep Learning approaches, thus enabling a structured examination of the use of consumer-grade wearable data – and its limitations in this context [9]-[14], [17], [70]. Among the models, XGBoost appeared to be the strongest, achieving 95% accuracy and a Macro F1-score of 0.84, and Random Forest shortly afterward. Logistic Regression, while it was less accurate overall, had the highest recall for sedentary days, indicating its usefulness in environments where the detection of Sedentary Behaviour is more critical than avoiding false positives. The Dense Neural Network produced similar results as SVM and KNN, whilst the LSTM sequence model performed poorly, demonstrating the challenges of applying a temporal Deep Learning with limited and uneven Fitbit data.
In comparison with previous research, the framework presented here represents several meaningful improvements. Previous research with accelerometers or activPAL posture sensors showed accuracies between 67% and 95%, depending on the research method (device type and granularity settings), and the Fitbit-based methods usually scored around 82%. In contrast, the performance levels achieved by this study were competitive with sensor-rich protocols [19]-[24], [60] with only off-the-shelf consumer wearables. The combination of both Machine Learning and Deep Learning in a unified evaluation pipeline, along with the deployment of a user-friendly Streamlit application, [15], [16], [66], [73] further emphasizes the originality and practical value of the work.
Finally, Sedentary Behaviour in this study was operationalised as time spent sedentary for a minimum of 600 minutes (10 hours) per day, in line with evidence in the established epidemiology and current public health recommendations. This definition helped ensure that the results are both methodologically and clinically significant, paving the way for Fitbit-based monitoring as a tool to be used in public health initiatives, both in the workplace and in wider public health efforts in a more scalable way.
Future Work
Future studies should place emphasis on better identification of the minority sedentary class, which still causes problems. Approaches such as class weighting, calibrated decision thresholds, and synthetic re-sampling methods such as SMOTE could provide a means of practically addressing class imbalance and improving recall for sedentary instances [57]-[59]. Extending the dataset to include longer periods of monitoring and a larger participant base would minimise problems associated with imbalance and limited sequence diversity.
From a modelling point of view, more complex temporal Deep Learning architectures (e.g., One-Dimensional Convolutional Neural Network, 1D-CNN [37], hybrid CNN-LSTM framework [39], [37], [39], [70], [72]) could be explored to better model time-related patterns in minute-level data. Transfer Learning and domain adaptation [64], [72] are also interesting opportunities for future work; using large-scale wearable datasets for pre-training could help increase the model robustness when operating with smaller/skewed Fitbit datasets. Such strategies may improve the performance of temporal models, such as LSTM, that have struggled with the constraints of the current study.
Further development of the Streamlit application [66], [73] is the next practical step. Some possible improvements are features such as multi-user access for workplace wellness schemes, automated reporting in PDF or CSV formats, and direct integration with Fitbit APIs to stream data in real-time rather than requiring manual uploads. User-oriented improvements could include customisable sedentary time thresholds (e.g., 480, 600, or 720 minutes) to reflect individual and/or organisational guidelines, personalised alerts for sedentary time, and sophisticated dashboards for weekly trends and comparisons to health recommendations. Finally, optimising the app to allow mobile deployment and strengthening the privacy and security mechanisms, [50]-[53], [65], [71] such as authentication and data anonymisation, would have the legal effect of improving usability and relevance for both the occupational health and clinical settings.
References
[1] M. S. Tremblay et al., “Sedentary behaviour research network: Standardized use of the terms ‘sedentary’ and ‘sedentary behaviours’,” Applied Physiology, Nutrition and Metabolism, vol. 42, no. 5, pp. 415–417, 2017.
[2] J. Castillo-Retamal and G. Hinckson, “Measuring physical activity and sedentary behaviour at work: A review,” Work, vol. 40, no. 4, pp. 345–357, 2011.
[3] K. E. Waters, A. M. Haskell, and D. R. George, “Sedentary behavior and musculoskeletal discomfort: A cross-sectional study,” Journal of Occupational and Environmental Medicine, vol. 58, no. 9, pp. 910–917, 2016.
[4] D. P. Bailey and A. P. Locke, “Breaking up prolonged sitting with light-intensity walking improves postprandial glycemia, but breaking up sitting with standing does not,” Frontiers in Public Health, vol. 7, p. 167, 2019.
[5] L. Parry and L. Straker, “The contribution of office work to sedentary behaviour associated risk,” Journal of Human Kinetics, vol. 37, pp. 1–10, 2013.
[6] A. E. Boerema et al., “Detection of sedentary behaviour with wearable sensors: A systematic literature review,” Sensors, vol. 16, no. 1, p. 22, 2016.
[7] S. Boudet et al., “Sedentary behaviour and occupational health: Measuring and intervention strategies,” Frontiers in Sports and Active Living, vol. 1, p. 1538807, 2023.
[8] K. Bongers et al., “Measuring physical activity in the office environment using wearable devices: A systematic review,” BMC Public Health, vol. 21, no. 87, 2021.
[9] M. Wang et al., “Predicting sedentary behaviour using Fitbit step count data and machine learning approaches,” Proceedings of the IEEE Engineering in Medicine and Biology Society (EMBC), 2021.
[10] S. Kańtoch, “Recognition of sedentary behaviour by machine-learning analysis of wearable sensors during activities of daily living,” Sensors, vol. 18, no. 11, p. 3219, 2018.
[11] T. Papathomas, P. Petridis, and A. Smith, “A machine-learning approach for prediction of sedentary behaviour based on daily step counts,” Proceedings of IEEE EMBC, 2021.
[12] L. Saint-Maurice et al., “Fitbit-based physical activity assessment in large-scale epidemiological studies,” International Journal of Environmental Research and Public Health, vol. 18, no. 8, p. 3914, 2021.
[13] L. Wang et al., “Fitbit data in the All of Us research program: Patterns and opportunities,” Journal of the American Heart Association, vol. 7, no. 7, 2018.
[14] A. Mahoney, M. Patel, and J. C. Smith, “Evaluation of Fitbit tracker validity for sedentary behaviour detection,” Sensors, vol. 23, no. 4, p. 2229, 2023.
[15] R. Chong, L. Liu, and T. Leung, “Gamification with Fitbit: Increasing daily steps through social leaderboards,” Proceedings of ACM International Conference on Pervasive Health, 2018.
[16] R. Farrahi and M. Rostami, “Machine learning in physical activity, sedentary, and sleep behaviour research,” Sports Medicine, vol. 54, pp. 123–139, 2024.
[17] T. Plötz, N. Y. Hammerla, and P. Olivier, “Deep, convolutional, and recurrent models for human activity recognition using wearables,” arXiv preprint arXiv:1604.08880, 2016.
[18] Z. Zhao et al., “Deep residual bidirectional LSTM for human activity recognition using wearable sensors,” Mathematical Problems in Engineering, vol. 2017, pp. 1–13, 2017.
[19] J. E. Koster et al., “Comparison of sedentary estimates between activPAL and ActiGraph,” Medicine and Science in Sports and Exercise, vol. 48, no. 8, pp. 1514–1522, 2016.
[20] A. V. Rowlands et al., “Accelerometer metrics that capture the physical activity profile,” Medicine and Science in Sports and Exercise, vol. 46, no. 5, pp. 982–989, 2014.
[21] J. Kerr et al., “Hip-worn accelerometer data for posture and sedentary behaviour classification using machine learning,” Medicine and Science in Sports and Exercise, vol. 50, no. 6, pp. 1275–1284, 2018.
[22] H. Jin et al., “SitPose: Real-time detection of sitting posture and sedentary behaviour using ensemble learning with depth sensor,” Journal of Intelligent and Robotic Systems, 2024.
[23] U. Ekelund et al., “Does physical activity attenuate the detrimental association of sitting time with mortality? A harmonised meta-analysis,” The Lancet, vol. 388, pp. 1302–1310, 2016.
[24] R. Patterson et al., “Sedentary behaviour and risk of all-cause, cardiovascular and cancer mortality: A meta-analysis,” European Journal of Epidemiology, vol. 33, pp. 811–829, 2018.
[25] A. Biswas et al., “Sedentary time and its association with disease incidence, mortality, and hospitalization,” Annals of Internal Medicine, vol. 162, no. 2, pp. 123–132, 2015.
[26] N. Owen et al., “Too much sitting: The population-health science of sedentary behavior,” Exercise and Sport Sciences Reviews, vol. 38, no. 3, pp. 105–113, 2010.
[27] A. Thorp et al., “Sedentary behaviors and subsequent health outcomes in adults: A systematic review of longitudinal studies,” American Journal of Preventive Medicine, vol. 41, no. 2, pp. 207–215, 2011.
[28] C. Matthews et al., “Amount of time spent in sedentary behaviors in the United States, 2003–2004,” American Journal of Epidemiology, vol. 167, no. 7, pp. 875–881, 2008.
[29] K. Y. Chen and D. R. Bassett, “The technology of accelerometry-based activity monitors: Current and future,” Medicine and Science in Sports and Exercise, vol. 37, no. 11, pp. S490–S500, 2005.
[30] H. Migueles et al., “Accelerometer data collection and processing criteria to assess physical activity/sedentary behavior,” Sports Medicine, vol. 47, no. 9, pp. 1821–1845, 2017.
[31] K. Evenson, M. Goto, and R. Furberg, “Systematic review of the validity and reliability of consumer-wearable activity trackers,” International Journal of Behavioral Nutrition and Physical Activity, vol. 12, no. 159, 2015.
[32] D. Feehan et al., “Accuracy of Fitbit devices: Systematic review,” JMIR mHealth and uHealth, vol. 6, no. 11, e11079, 2018.
[33] S. Bai et al., “A comparison of consumer activity monitors under free-living conditions,” Medicine and Science in Sports and Exercise, vol. 50, no. 1, pp. 131–138, 2018.
[34] D. Anguita et al., “A public domain dataset for human activity recognition using smartphones,” Proceedings of ESANN, 2013.
[35] A. Reiss and D. Stricker, “Introducing a new benchmarked dataset for activity monitoring,” Proceedings of ISWC, 2012.
[36] N. Y. Hammerla, S. Halloran, and T. Plötz, “Deep, convolutional, and recurrent models for sensor-based activity recognition,” Proceedings of IJCAI, 2016.
[37] F. Ordóñez and D. Roggen, “Deep convolutional and LSTM recurrent neural networks for multimodal wearable activity recognition,” Sensors, vol. 16, no. 1, p. 115, 2016.
[38] J. Ronao and S.-B. Cho, “Human activity recognition with smartphone sensors using deep learning neural networks,” Expert Systems with Applications, vol. 59, pp. 235–244, 2016.
[39] A. Ignatov, “Real-time human activity recognition from accelerometer data using convolutional neural networks,” Applied Soft Computing, vol. 62, pp. 915–922, 2018.
[40] T. Chen and C. Guestrin, “XGBoost: A scalable tree boosting system,” Proceedings of ACM KDD, 2016.
[41] L. Breiman, “Random forests,” Machine Learning, vol. 45, no. 1, pp. 5–32, 2001.
[42] C. Cortes and V. Vapnik, “Support-vector networks,” Machine Learning, vol. 20, pp. 273–297, 1995.
[43] I. Goodfellow, Y. Bengio, and A. Courville, Deep Learning. MIT Press, 2016.
[44] D. P. Kingma and J. Ba, “Adam: A method for stochastic optimization,” Proceedings of ICLR, 2015.
[45] N. Srivastava et al., “Dropout: A simple way to prevent neural networks from overfitting,” Journal of Machine Learning Research, vol. 15, pp. 1929–1958, 2014.
[46] S. Hochreiter and J. Schmidhuber, “Long short-term memory,” Neural Computation, vol. 9, no. 8, pp. 1735–1780, 1997.
[47] F. Pedregosa et al., “Scikit-learn: Machine learning in Python,” Journal of Machine Learning Research, vol. 12, pp. 2825–2830, 2011.
[48] M. Abadi et al., “TensorFlow: Large-scale machine learning on heterogeneous systems,” Proceedings of USENIX OSDI, 2016.
[49] F. Chollet, Keras. GitHub, 2015.
[50] S. M. Lundberg and S.-I. Lee, “A unified approach to interpreting model predictions,” Advances in Neural Information Processing Systems (NeurIPS), vol. 30, pp. 4765–4774, 2017.
[51] M. T. Ribeiro, S. Singh, and C. Guestrin, “Why should I trust you?: Explaining the predictions of any classifier,” Proceedings of ACM KDD, 2016.
[52] A. Shrikumar, P. Greenside, and A. Kundaje, “Learning important features through propagating activation differences,” Proceedings of ICML, 2017.
[53] C. Molnar, Interpretable Machine Learning, 2nd ed., 2022.
[54] T. Fawcett, “An introduction to ROC analysis,” Pattern Recognition Letters, vol. 27, pp. 861–874, 2006.
[55] T. Saito and M. Rehmsmeier, “The precision–recall plot is more informative than the ROC plot when evaluating binary classifiers on imbalanced datasets,” PLoS ONE, vol. 10, e0118432, 2015.
[56] D. M. W. Powers, “Evaluation: From precision, recall and F-measure to ROC, informedness, markedness & correlation,” Journal of Machine Learning Technologies, vol. 2, pp. 37–63, 2011.
[57] N. V. Chawla et al., “SMOTE: Synthetic Minority Over-sampling Technique,” Journal of Artificial Intelligence Research, vol. 16, pp. 321–357, 2002.
[58] H. He and E. A. Garcia, “Learning from imbalanced data,” IEEE Transactions on Knowledge and Data Engineering, vol. 21, no. 9, pp. 1263–1284, 2009.
[59] B. Krawczyk, “Learning from imbalanced data: Open challenges and future directions,” Progress in Artificial Intelligence, vol. 5, pp. 221–232, 2016.
[60] U.K. Chief Medical Officers, Physical Activity Guidelines, London: Department of Health and Social Care, 2019.
[61] R. F. Gillman et al., “Wearable sensor technology for monitoring sedentary behavior: A scoping review,” Sensors, vol. 23, no. 12, 2023.
[62] K. F. Chastin et al., “Systematic scoping review of sedentary behaviour in the workplace,” Occupational Medicine, vol. 72, no. 4, pp. 231–244, 2022.
[63] M. Chung et al., “Daily activity recognition using wearable sensors: A survey,” Sensors, vol. 19, p. 4049, 2019.
[64] R. W. Sitaram et al., “Transfer learning in wearable activity recognition: A survey,” IEEE Access, vol. 10, pp. 35714–35729, 2022.
[65] J. M. Delgado et al., “Explainable artificial intelligence for health monitoring with wearable sensors,” Frontiers in Digital Health, vol. 4, p. 915724, 2022.
[66] P. Woznowski et al., “Activity recognition using wearable, smartphone and IoT devices,” Sensors, vol. 19, p. 3569, 2019.
[67] K. E. Ellingson et al., “Evaluating Fitbit data validity for step count and energy expenditure in adults,” Medicine and Science in Sports and Exercise, vol. 53, no. 5, pp. 1042–1050, 2021.
[68] S. R. Kaikkonen et al., “Reliability of consumer-grade wearables for long-term physical activity monitoring,” JMIR Formative Research, vol. 6, no. 5, e33714, 2022.
[69] J. B. Schuna Jr. et al., “Validation of Fitbit step counts and distance for older adults,” BMJ Open Sport & Exercise Medicine, vol. 7, e001054, 2021.
[70] A. K. Gupta et al., “Deep learning for human activity recognition: A comprehensive survey,” IEEE Access, vol. 9, pp. 155–199, 2021.
[71] L. Chen et al., “Explainable deep learning models for healthcare: Survey, applications, and challenges,” ACM Computing Surveys, vol. 55, no. 5, 2023.
[72] H. Yin and Q. Zhang, “Improving wearable-based physical activity recognition through data augmentation and transfer learning,” Pattern Recognition, vol. 131, 2022.
[73] D. Rahman, “Fitbit Sedentary Behaviour Detection Project,” MSc Dissertation, Ulster University, 2025.
[74] P. Krishnan et al., “A review on sedentary behaviour detection and analysis using wearable sensors,” Journal of Biomedical Informatics, vol. 140, 2023.
[75] T. Munir et al., “Machine learning-driven human activity and posture classification using Fitbit data,” Frontiers in Public Health, vol. 11, p. 1121456, 2023.
Licensed
© 2026 Copyright by the Authors.
Licensed as an open access article using a CC BY 4.0 license.
Article Contents Author Gilbert Talaue1, * 1Jubail Industrial College, Al Jubail, Saudi Arabia Article History: Received: 11 November, 2025 Accepted:
Article Contents Author Burhannetin Uysal1, * Maria Malik2 1College of Business-Al Khobar, Al Yamamah University, Saudi Arabia Article History: Received:
Article Contents Author Sercan Alabay1, * 1College of Business-Al Khobar, Al Yamamah University, Saudi Arabia Article History: Received: 11 January,
Article Contents Author Danish Rahman1, * Matias Garcia-Constantino1 1School of Computing, Ulster University, Belfast Campus, BT151AP, United Kingdom Article
Article Contents Author Arsalan Sheikh1, * 1COMSATS University, Islamabad, Pakistan Article History: Received: 11 January, 2026 Accepted: 03 March,
Article Contents Author Mushtaq Ali1, * Imad Ullah1 1Riphah Institute of Informatics, Malakand Campus, Riphah International University Islamabad, Pakistan Article